

I’m very pleased to announce the launch of Xmrit.
Over the past eight months, my team at Commoncog have been iterating on a tool to rapidly create and share XmR charts. We’ve been using Xmrit operationally for about five months now, and we are very confident that the tool is ready for wide use.
(Xmrit is pronounced ‘xa-merit’, in case you’re wondering.)
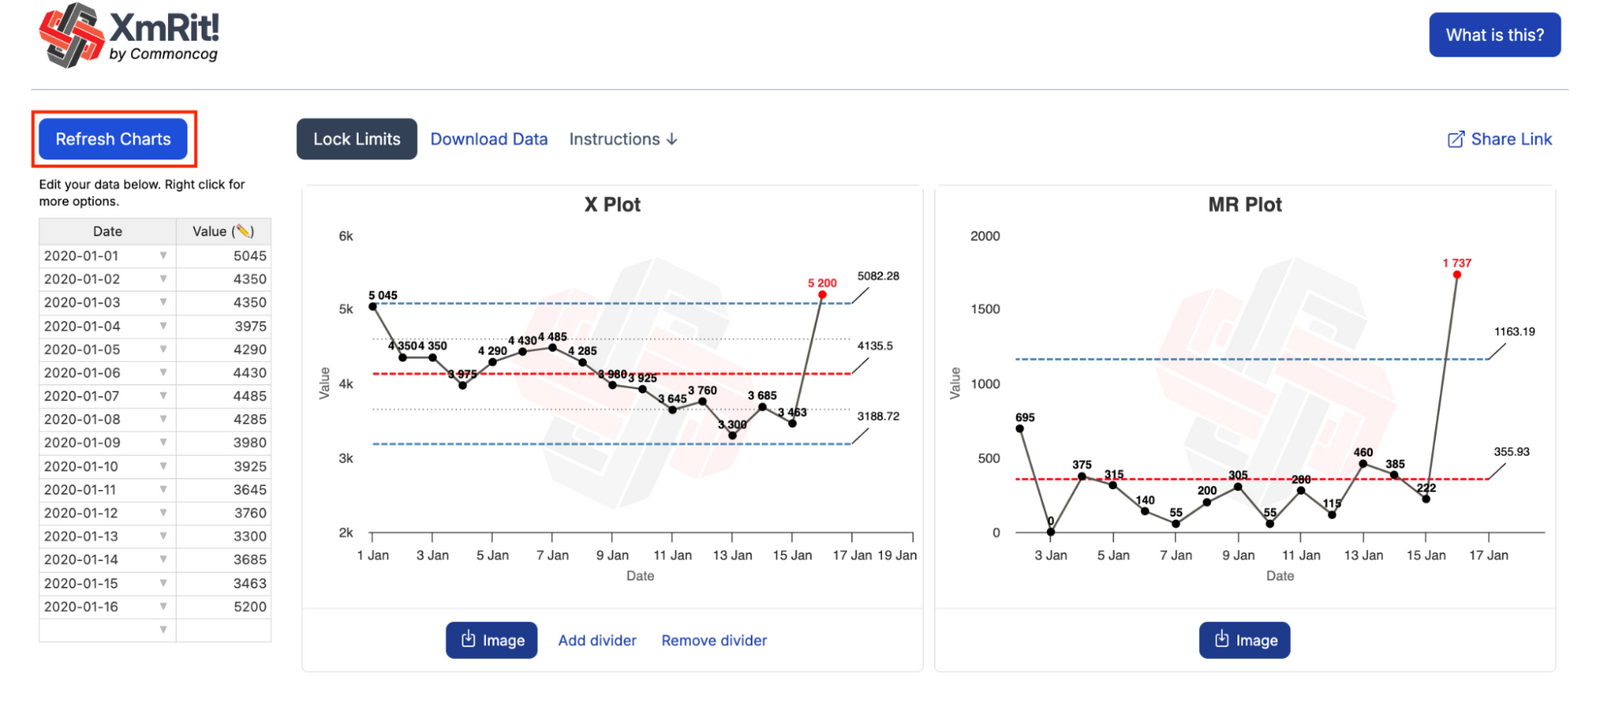
So, what is it? Xmrit is a free, browser-based tool that makes it easy for you to create, modify, experiment with and share XmR charts. Here’s what it looks like:
If you do not know what XmR charts are, the broad pitch is that XmR charts tell you when something has changed in your data. This simple property unlocks something quite powerful: it allows you to uncover the causal structure of your business. For more information on how you may use XmR charts to accomplish this, read Becoming Data Driven, From First Principles.
There are a number of features that make Xmrit useful. For instance, I can generate links to quickly share analyses. The following is a chart of Commoncog’s Average Session Duration:
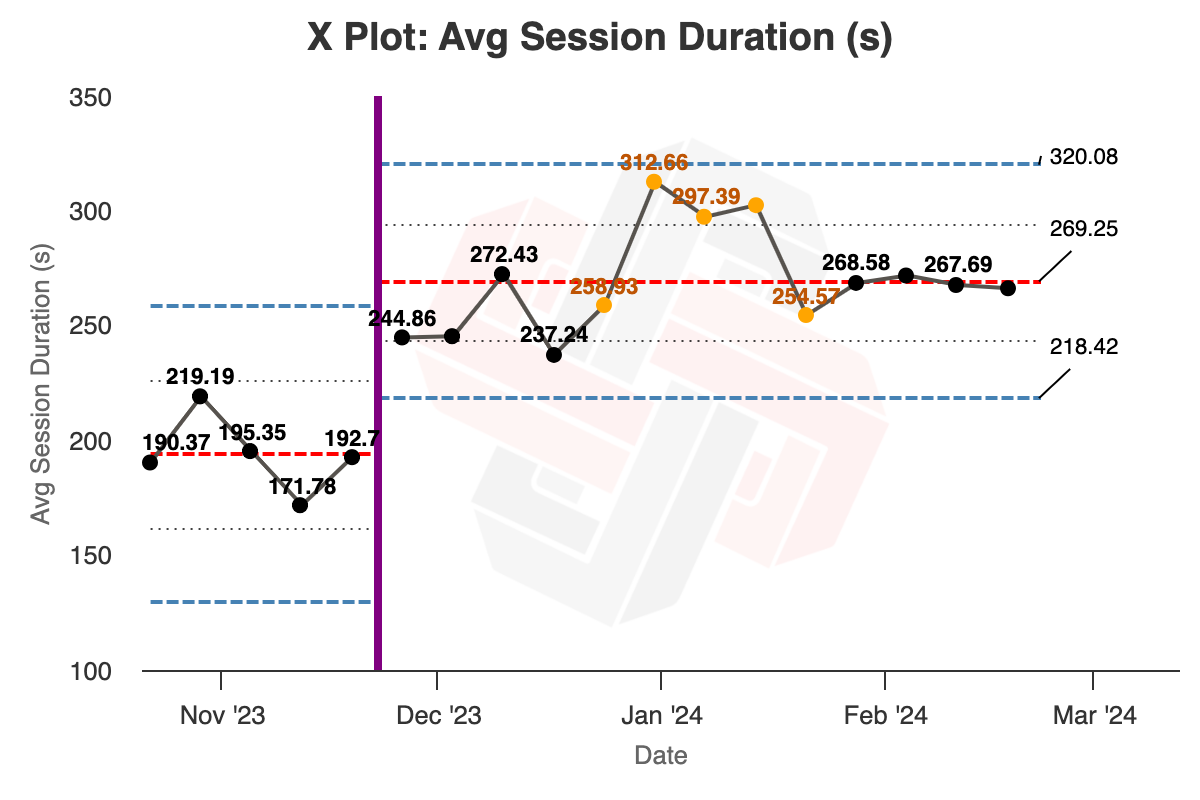
You may play with this chart yourself at this link.
You’ll also notice that there’s a divider placed in the chart. This is another Xmrit-only feature. Try dragging the divider around. Observe how Xmrit’s chart responds and recalculates limit lines based on your divider position.
The divider position that you see in the image above is not accidental: it corresponds to the week where we launched the Commoncog Case Library. Average session duration shifted permanently after we launched. When we discovered this behaviour, we started thinking:
- Hmm. Maybe the Case Library is sticky!
- We should probably redesign the Commoncog website to make the library more prominent. If doing so increases average session duration even further, then we have confirmed point (1).
This is what I mean when I say (quoting statistitican Donald Wheeler): “XmR charts are the beginning of knowledge”. Knowledge is defined as ‘theories or models that allow you to better predict the outcomes of your business actions.’ We observe an exceptional change in our metrics. We investigate and discover some causal action. We then take new action to confirm that the causal relationship is true.
Rinse and repeat. At this point we’ve had maybe a dozen such insights. We are — as a teammate put it — slowly uncovering the causal structure of Commoncog’s core business. (“I never thought we would be able to understand how a business truly works” one of them said, during one of our WBRs). We’ve already doubled revenue over the past year, as a result of such knowledge. I am quietly confident that we can do the same this year (and perhaps even surpass that target; it depends on what other pieces of knowledge we uncover in the coming weeks).
And now — with Xmrit — you can do the same.
There are a few more features that make Xmrit special:
- You can integrate with it by programmatically creating share links: read this guide for more details. This is, incidentally, how we integrate with our own internal WBR software.
- You can lock limit lines. Read this section of the User Manual for why you might want to do this.
- We’re going to open source it in a few days. If you don’t feel comfortable plugging your company data into Xmrit, wait a few more days. Xmrit was always intended to be open sourced. If you’d like an update, I recommend signing up for the free email course on Xmrit.com. That puts you on our mailing list. We’ll tell you when it’s out.
And on that note …
Sign up for Xmrit’s Free Email Course!
Sam Taylor is my collaborator on Xmrit. In a previous life, Sam worked in manufacturing. He has been very influential on my thinking about industrial methods and industrial business models. Over the past month, we’ve been hard at work at writing up a free email course over at Xmrit.com to introduce you to these methods.
I’m very proud of what we’ve accomplished. This is over 10,000 words of teaching, spread over nine days, and I think it’s pretty good stuff. It’s very much what I wish I had when I first encountered these methods.
And so! To reiterate: if you’re interested in using XmR charts in your company, you should sign up for the free email course.
In a couple of months, we’ll be launching a paid course called The Metrics Masterclass — which covers everything you’ll need to know about using XmR charts in practice.

Sam and I intend to turn Xmrit.com into the world’s best place to learn about these — and other — methods. (And, if you can believe it, Sam is even more passionate about these tools than I am!)
You shouldn’t need to buy multiple books and read a dozen statistical papers, or do 1.5 years of trial and error to figure out how to use these charts outside of manufacturing. (Which, ahem, is what we’ve done). The method is so simple and so useful that you should be able to use it today. The good news is that we’ve already done the hard work for you.
The Metrics Masterclass will be $299 at launch. At preorder, it costs $199. And if you go through the free email course on Xmrit.com, you’ll get an additional discount at the end.
We hope that over the next few years, using our free tools, some simple methods, and much education — both free and paid — we’ll be able to increase the number of data-driven companies that exist in the world.
Wrapping up
I’d like to thank a number of people for working on Xmrit with me. Aw Hang Bin wrote the first version of Xmrit during an internship he did with us last year. Sam Taylor, of course, tested and shaped the Xmrit tool for a huge chunk of the life of the project. Ben rewrote the tool, and thought up and created the integration for Xmrit — which led us to learn that we didn’t have a good sense of routine variation in our metrics. I’d also like to thank the rest of the Commoncog team who have been testing Xmrit in their own work contexts.
Commoncog members received early access to Xmrit a few weeks ago, so this isn’t news to them. And hopefully they’ve already started experimenting with it!
If I could say one last thing:
I hope that you’ll take these ideas seriously. Go on, give it a try. The point of writing all these essays, of testing these ideas in practice, and now — of building free tools that we release to the world — is so that you can use them. As I joke to my friends, crudely: “the goal is not to talk; it is to use these methods and get rich!”
I look forward to hearing how it’s turned out.
PS: Sam and I were on the Monday Morning Data Chat to talk about Xmrit and about Statistical Process Control. Watch that here:
Originally published , last updated .