

You may need to read the previous essay — titled Becoming Data Driven, From First Principles — to get the most out of this one. That essay lays out the worldview that backs the WBR. Do that first.
Note: I learnt my practice of the Amazon-style WBR from early Amazon exec (and Jeff Bezos’s second shadow) Colin Bryar; over the course of 2022 I helped him explicate the practice of the WBR for his clients. Everything good here is attributable to him; all mistakes are mine alone.
Every Wednesday morning, Amazon’s executive team gets together and goes through 400-500 metrics that represents the current state of Amazon’s various businesses. The meeting lasts 60 minutes, except for when it’s the holiday shopping season, in which case they sit together for 90 minutes. Amazon’s leadership meets for the Weekly Business Review every week, without fail, even when the CEO or CFO isn’t present. They’ve been doing this since the early 2000s.
Earlier this year I wrote that one way to look at the Amazon-style WBR is to call it a ‘highly prescriptive mechanism to present and absorb a large amount of business data in a short amount of time.’ But we now know, of course, that this isn’t entirely accurate: a better way of thinking about the WBR is that it is a process control tool — that is, a tool designed to uncover and disseminate the causal structure of a business, so that you may execute with knowledge. Knowledge is defined as ‘theories or models that allow you to better predict the outcomes of your business actions.’ With knowledge, you may accomplish your business objectives, understand the levers you have available to you, turn the screws on your competition, and win. We know this because we’ve spent the previous entry in this series — a whole 9000 words — explaining what process control even is, and why it demands a different worldview for using data.
Now that you have a feel for the worldview behind the WBR, we’re going to talk about the structure of the mechanism, touch on some of the innovations Amazon’s leaders have created over the years that they’ve been running it, before talking briefly about what is hard about putting it to practice.
I’ll write a follow-up piece on what I’ve learnt actually applying the WBR to my business context. And then I’ll bring the entire Becoming Data Driven series to a close.
The Goals of the WBR
The Amazon-style WBR is designed to answer three questions:
- What did our customers experience last week?
- How did our business do last week?
- Are we on track to hit targets?
These three questions are the explicit goals that leadership will discuss during the meeting, and as such are the three questions you should ask yourself when you start putting the WBR to practice.
(Note that there are other implicit goals, embedded in the practice, but we’ll talk about those later.)
The ordering of the three questions matter. One way of thinking about the first two questions is that they are actually different ways of asking about the business.
Here’s a story to illustrate what I mean.
Early on in Amazon’s practice of the WBR, Jeff Bezos observed that customers who visited Amazon.com were very likely to do comparison shopping: they would come in looking for a specific item, and they would know the price of that item if bought from one of Amazon’s competitors. If Amazon’s customers knew the prices of items in other stores, so too should Amazon’s executives: it was unacceptable that the customer would experience something on a weekly basis that Amazon’s leaders did not. And so Bezos ordered that the WBR include the prices of the top 10 selling items in each major e-commerce category, along with prices of the same product if bought from Target or Walmart or some other competitor. This decision added a whole number of tables to Amazon’s WBR metrics deck; Bezos did this so that Amazon’s execs would have a fingertip-feel for something that a large portion of Amazon’s customers would experience every week.
Most businesses ask “how did the business do last week?” instead of “what did the customer experience last week?” If you ask the first question, you will have an implicit orientation towards internal, business-first metrics. Perhaps you might watch inventory turns, or track changes in free cash flow, or measure the performance of your warehouses. To be clear, these are all important metrics to track. But notice that if you ask “what did the customer experience last week?” you’ll measure slightly different things. And so it’s important to ask both questions, and to ask the ‘customer’ question first — it’s not for nothing that Amazon aims to be ‘Earth’s most customer-centric company.’
The third question is about targets.
Amazon sets targets for its most important metrics in an annual planning cycle it calls ‘OP1/OP2’ — or ‘Operational Planning 1 and 2’. In Working Backwards, Colin Bryar and Bill Carr write:
Amazon’s planning for the calendar year begins in the summer. It’s a painstaking process that requires four to eight weeks of intensive work for the managers and many staff members of every team in the company. This intensity is deliberate, because a poorly defined plan — or worse, no plan at all — can incur a much greater downstream cost.
The S-Team (read: Senior Team) begins by creating a set of high-level expectations or objectives for the entire company. For example, in previous years, the CEO and CFO would articulate goals like “Grow revenue from $10 billion to $15 billion” or “Reduce fixed costs by 5 percent.” Over time, Amazon refined such broad goals into a longer list of increasingly detailed objectives. Examples have included: revenue growth targets by geography and business segment; operating leverage targets; improving productivity and giving back those savings to customers in the form of lower prices; generating strong free cash flow; and understanding the level of investment in new businesses, products, and services.
Once these high-level expectations are established, each group begins work on its own more granular operating plan—known as OP1—which sets out the individual group’s “bottom-up” proposal. Through the narrative process (described in chapter four of Working Backwards), Amazon aims to evaluate about ten times as much information as the typical company does in a similar time frame. The main components of an OP1 narrative are:
- Assessment of past performance, including goals achieved, goals missed, and lessons learned.
- Key initiatives for the following year
- A detailed income statement
- Requests (and justifications) for resources, which may include things like new hires, marketing spend, equipment and other fixed assets
(…) The OP1 process runs through the fall and is completed before the fourth-quarter holiday rush begins. In January, after the holiday season ends, OP1 is adjusted as necessary to reflect the fourth-quarter results, as well as to update the trajectory of the business. This shorter process is called OP2, and it generates the plan of record for the calendar year.
OP2 aligns each group with the goals of the company. Everybody knows their overall objectives, including targets for revenue, cost, and performance. The metrics are agreed upon and will be supplied as part of every team’s deliverables. OP2 makes it crystal clear what each group has committed to do, how they intend to achieve those goals, and what resources they need to get the work done.
Some variances are inevitable, but any change to OP2 requires formal S-Team approval.
I should note that your practice of the WBR need not follow Amazon’s goal-setting processes. For the sake of completeness, however, we should talk a little about how both practices fit together.
Bryar and Carr continue, in Working Backwards (all emphasis mine):
During OP1, as the S-Team reads and reviews the various operating plans, they select the initiatives and goals from each team that they consider to be the most important to achieve. These selected goals are called, unsurprisingly, S-Team goals. In other words, my (Bill’s) team working on Amazon Music might have had 23 goals and initiatives in our 2012 operating plan. After reviewing our plan with us, the S-Team might have chosen six of the 23 to become S-Team goals. The music team would still have worked to achieve all 23 goals, but it would be sure to make resource allocation decisions throughout the year to prioritize the six S-Team goals ahead of the remaining 17.
Three notably Amazonian features of S-Team goals are their unusually large number, their level of detail, and their aggressiveness. S-Team goals once numbered in the dozens, but these have expanded to many hundreds every year, scattered across the entire company.
S-Team goals are mainly input-focused metrics that measure the specific activities teams need to perform during the year that, if achieved, will yield the desired business results. (…) S-Team goals must be Specific, Measurable, Attainable, Relevant, and Timely (SMART). An actual S-Team goal could be as specific as “Add 500 new products in the amazon.fr Musical Instruments category (100 products in Q1, 200 in Q2…),” or “Ensure 99.99 percent of all calls to software service ‘Y’ are successfully responded to within 10 milliseconds,” or “Increase repeat advertisers from 50 percent to 75 percent by Q3 of next year.”
S-Team goals are aggressive enough that Amazon only expects about three-quarters of them to be fully achieved during the year. Hitting every one of them would be a clear sign that the bar had been set too low.
S-Team goals for the entire company are aggregated and their metrics are tracked with centralised tools by the finance team. Each undergoes an intensive quarterly review that calls for thorough preparation. Reviews are conducted in multi-hour S-Team meetings scheduled on a rolling basis over the quarter rather than all at once. At many companies, when the senior leadership meets, they tend to focus more on big-picture, high-level strategy issues than on execution. At Amazon, it’s the opposite. Amazon leaders toil over the execution details and regularly embody the Dive Deep leadership principle, which states: “Leaders operate at all levels, stay connected to the details, audit frequently, and are skeptical when metrics and anecdotes differ. No task is beneath them.”
The finance team tracks the S-Team goals throughout the year with a status of green, yellow, and red. Green means you are on track, yellow means there is some risk of missing the goal, and red means you are not likely to hit the goal unless something meaningful changes. During the periodic reviews, yellow or red status draws the team’s attention where it’s needed most, and a frank discussion about what’s wrong and how it will be addressed ensues.
Bear in mind that a basic understanding of variation is expected at Amazon — many of these goals expect teams to fundamentally change the behaviour of a metric (bring the range of variation up, to use the terminology of Statistical Process Control), instead of distorting the system, or distorting the data. We’ve also covered how the Finance department is empowered to independently audit metrics, to ensure distortions aren’t happening at a lower level.
Finally, note that S-team goals are mostly controllable input metrics. We’ll talk about controllable input metrics vs output metrics in the next section.
For now, I’ll say that it’s valuable to think through how your metrics review process interacts with your incentivisation process. The WBR is a purely operational meeting, but the fact that it contains goals (‘are we on track to hit targets?’) and is administered by the same department that audits progress against those targets means that it ties longer-term strategy with shorter term incentives.
With that said, I do have a few questions that remain unanswered. I have not tied my practice of the WBR to employee incentives (my business is simply too small for me to do so); as a result, it’s not clear to me how goal-setting works if you, say, set the wrong controllable input metric as a goal.
In an earlier essay I told a story from Working Backwards where an Amazon team was incentivised to chase the wrong controllable input metric. Colin Bryar said that the team wasn’t punished when leadership corrected the input metric … but how was the perf evaluation for that team adjusted? If the team’s bonuses depended on execution against a controllable input metric goal, and that input metric changed from under them (because it was the wrong goal) — was the team’s performance evaluation negatively affected?
I suspect the answer has to do with the nature of employee comp in Amazon — Amazon’s stock grants are famously adjusted for the long term, to encourage employees to ‘think like owners’ — and perhaps whatever impact is muted because employees are incentivised for long term per-share equity growth. I am also fairly certain that whatever answer here will have diverged from the platonic ideal that I’m describing — especially given Amazon’s age and its size (as of writing, Amazon is the second largest employer in the world).
No matter; the point isn’t that you are meant to copy these ideas wholesale — the point is that you know that the WBR works partly because targets are part of the meeting. Your practice of the WBR will have to be tuned to the incentivisation structure you use in your company; you are supposed to find something that works for you.
Controllable Input Metrics and Output Metrics
A huge part of the Amazon WBR is built around the concept of ‘controllable input metrics’ and ‘output metrics’. These two types of metrics actually fall out of a process control worldview, as we’ve discussed in a prior blog post.
- Controllable input metrics are exactly as described: they are directly actionable (hence ‘controllable’), and they impact some output metric you care about (hence the name ‘input’). Examples include some of the metrics discussed in the previous section, like “Add 500 new products to the Musical Instruments category of Amazon.com.fr (100 in Q1, 200 in Q2 …)” or “Run at least 20 newsletter ads per month.”
- Output metrics are metrics that you ultimately care about. These are things like ‘number of engaged users’ or ‘revenue’, or ‘absolute dollar free cash flow’, or ‘contribution profit’ or ‘DAU/MAU ratio’. You are not allowed to discuss output metrics during the WBR, except in a reporting sense — the way to hit your output metric targets is to seek out controllable input metrics for each of your output metrics and drive those.
- The output metric for one process may be a controllable input metric for another process in your business. Such causal links should emerge slowly, as you run your WBR week after week, and probe for relationships between each metric.
- A small number of metrics in the WBR are neither controllable input metric nor output metric; they are there purely for reporting or context-setting purposes. As an example, ‘percentage of mobile traffic vs desktop traffic’, for instance, is still a useful metric to look at each week. It might not be directly applicable to your goals, but it is important contextual information for every executive to know.
- The metrics in a WBR are not static — you are expected to add or discard controllable input metrics as they stop working (that is, you continue to drive them, but they stop showing an effect on the corresponding output metric). You may also drop metrics that are no longer strategic priorities at the exec level, but include them in lower-level departmental WBRs.
I’ll show you examples of WBR decks in a bit, but the overarching goal here is that your metrics must be laid out in a logical, causal way: controllable input metrics at the start of the deck, corresponding output metrics immediately after; and then rinse and repeat your input and output metrics for each major initiative or department, ending with financial metrics at the end. As an example of what this might look like: for publication or e-commerce companies, typically the deck opens with web + mobile traffic, flows into customer engagement (or various other metrics, depending on the specifics of your business), and then ends with financials on the other end.
The point is that you want to present your business as an end-to-end process. The WBR reinforces the view that a business is simply a box that takes in inputs and activities on one end and spits out cash the other. Done well, the meeting should disseminate the same mental model of the business to all the operators responsible for running it.
The Shape of the WBR
What is sitting in on a WBR like? The flow of events goes roughly as follows:
After midnight on Sunday, the metrics for the prior week are generated. On Monday morning each metric owner comes into work and reviews their numbers for the past week. To be clear, metric owners are expected to review their numbers daily. This familiarity should make it easier to pattern match when anomalies occur: metric owners are expected to recognise exceptional variation in weekly numbers, and are expected to investigate if exceptional variation is detected.
On Tuesday morning, departmental WBRs are held throughout the company. Not every department in Amazon runs a WBR; sometimes WBRs are conducted at the level of the business unit (which may cut across a few departments). WBRs at this level review a larger, more comprehensive set of metrics than those presented at the company-level WBR the very next day. Again, metric owners are expected to have investigated and then present causes for exceptional variation during these meetings. If they have not successfully identified a root cause for the exception, they are expected to say “I don’t know”. A department-level leader is expected to investigate alongside them.
The company-level WBR is held on Wednesday morning. Amazon regards this WBR as the single most expensive meeting in the company; every executive of note attends. This in turn means that the WBR is conducted like a tightly scripted, tightly choreographed affair. The meeting opens with a facilitator (typically from Finance), who goes through follow-ups from the prior week’s WBR. Then, everyone turns to the WBR deck and looks at their first graph.
The handoff between facilitator to metric owner, and then from metrics owner to metrics owner should be seamless. Each metrics owner will speak up for their graph (though an owner may own multiple metrics, so may speak up multiple times). If the metric shows only routine variation, the owner will say “nothing to see here”; everyone stares at the graph for one second, and then the entire meeting moves on to the next graph. You are not allowed to skip metrics, even if it displays just routine variation — looking at each metric, even for one second, helps build a fingertip-feel for ‘normal’.
The WBR is exception-driven. This means that you really only discuss exceptional variation: if there is an exception for a given metric (or if the metric has a target and the graph shows you have missed the target for a few weeks), then the owner will have to explain the issue. Alternatively, they may say “we don’t know and are still investigating” — and the facilitator makes a note to follow up. At no point are you allowed to pull an explanation out from your ass.
The WBR is run like clockwork, which means preparation for the meeting is key. If you are a leader, you are not allowed to appear as if you’re unfamiliar with a metric from your org during the meeting (this applies even if you are not the direct metrics owner; at Amazon, leaders are expected to ‘Dive Deep’; meaning they should have a handle on everything that occurs in their own businesses). Handoff between each metrics owner should occur under two seconds. The WBR deck is static (in early years it was printed out on paper, with a copy for each participant); waiting precious seconds for dashboards to load or for a presenter to switch tabs in a browser is simply unacceptable.
The only exception to this rule is the ‘Voice of the Customer’ program, which is typically presented as a slide, separate from whatever software is used to present WBR metrics. From Working Backwards:
Amazon employs many techniques to ensure that anecdotes reach the teams that own and operate a service. One example is a program called the Voice of the Customer. The customer service department routinely collects and summarises customer feedback and presents it during the WBR, though not necessarily every week. The chosen feedback does not always reflect the most commonly received complaint, and the CS department has wide latitude on what to present (emphasis mine). When the stories are read at the WBR, they are often painful to hear because they highlight just how much we let customers down. But they always provide a learning experience and an opportunity for us to improve.
And as an example of what that might look like:
One Voice of the Customer story was about an incident when our software barraged a few credit cards with repeated $1.00 pre-authorisations that normally happen only once per order. The customers weren’t charged, and such pre-authorisations expire after a few days, but while they were pending, they counted against credit limits. Usually, this would not have much of an effect on the customer. But one customer wrote to say that just after buying an item on Amazon, she went to buy medicine for her child, and her card was declined. She asked that we help resolve the issue so she could purchase the medicine her child needed. At first, an investigation into her complaint revealed that an edge-case bug — another way of saying a rare occurrence — had bumped her card balance over the limit. Many companies would dismiss such cases as outliers, and thus not worthy of attention, on the assumption that they rarely happen and are too expensive to fix. At Amazon, such cases were regularly attended to because they would happen again and because the investigation often revealed adjacent problems that needed to be solved. What at first looked to be just an edge case turned out to be more significant. The bug had caused problems in other areas that we did not initially notice. We quickly fixed the problem for her and for all other impacted customers.
Discussions on strategy or on problem solving are not allowed during the WBR. (To reiterate: the meeting is operational, not strategic, and must run under 60 minutes). If a protracted discussion breaks out, the facilitator of the WBR is allowed to cut in to suggest taking the discussion offline. He or she will schedule a follow up with the relevant parties after the WBR has concluded.
Weekly strategic meetings do exist at Amazon — these are typically referred to as ‘S-team meetings’ and are held separately from the WBR. At Amazon’s scale, keeping strategic and operational discussions separate makes for more productive meetings. But the two are related: executives do their sensemaking in the WBR, which informs their decision-making in their strategy discussions.
Ostensibly, the WBR is conducted for the CEO or the CFO. (The CFO runs the Finance department, after all, and Finance administers the WBR). In reality, the WBR is held by and for the operators running the business. This means that even if the CEO or CFO are not present, the WBR runs as expected.
Colin told me that one trick he uses for introducing the WBR at a new company is to run the WBR for a few months, and then find an excuse to skip a week. Upon coming back, he would ask “so … what did you all discuss for metric X (where metric X is some exception the prior week) … and what action did you propose we take?” — as a test to see if the WBR was run properly in his absence. You’ll know that a WBR has truly taken in your organisation if it’s able to run without you.
At this point, I’ve spent a lot of time talking about the WBR process itself, not on the tools or the contents of the WBR deck. This is intentional. The most important thing I’ve learnt from Colin is that good data practices stem from culture, not from tooling. To use slightly fancy words, data practices are the result of a ‘socio-technical system within your company’ — which is to say that it is the result of an interplay between social dynamics and technical systems. You need to get the culture right first, before talking about the technical systems that are designed to support those social practices.
With that context in mind, let’s talk about the contents of the WBR deck.
The WBR Deck
Amazon WBR decks have three visualisation types. This is not a hard constraint, but also not an accident: Amazon believes that you’re only able to build fingertip-feel for your data if you receive the data in exactly the same colours, in exactly the same graph format, using the exact same fonts each week. You also get the sense that each visualisation type was chosen to communicate the largest amount of information in the smallest amount of time.
The 6-12 Graph
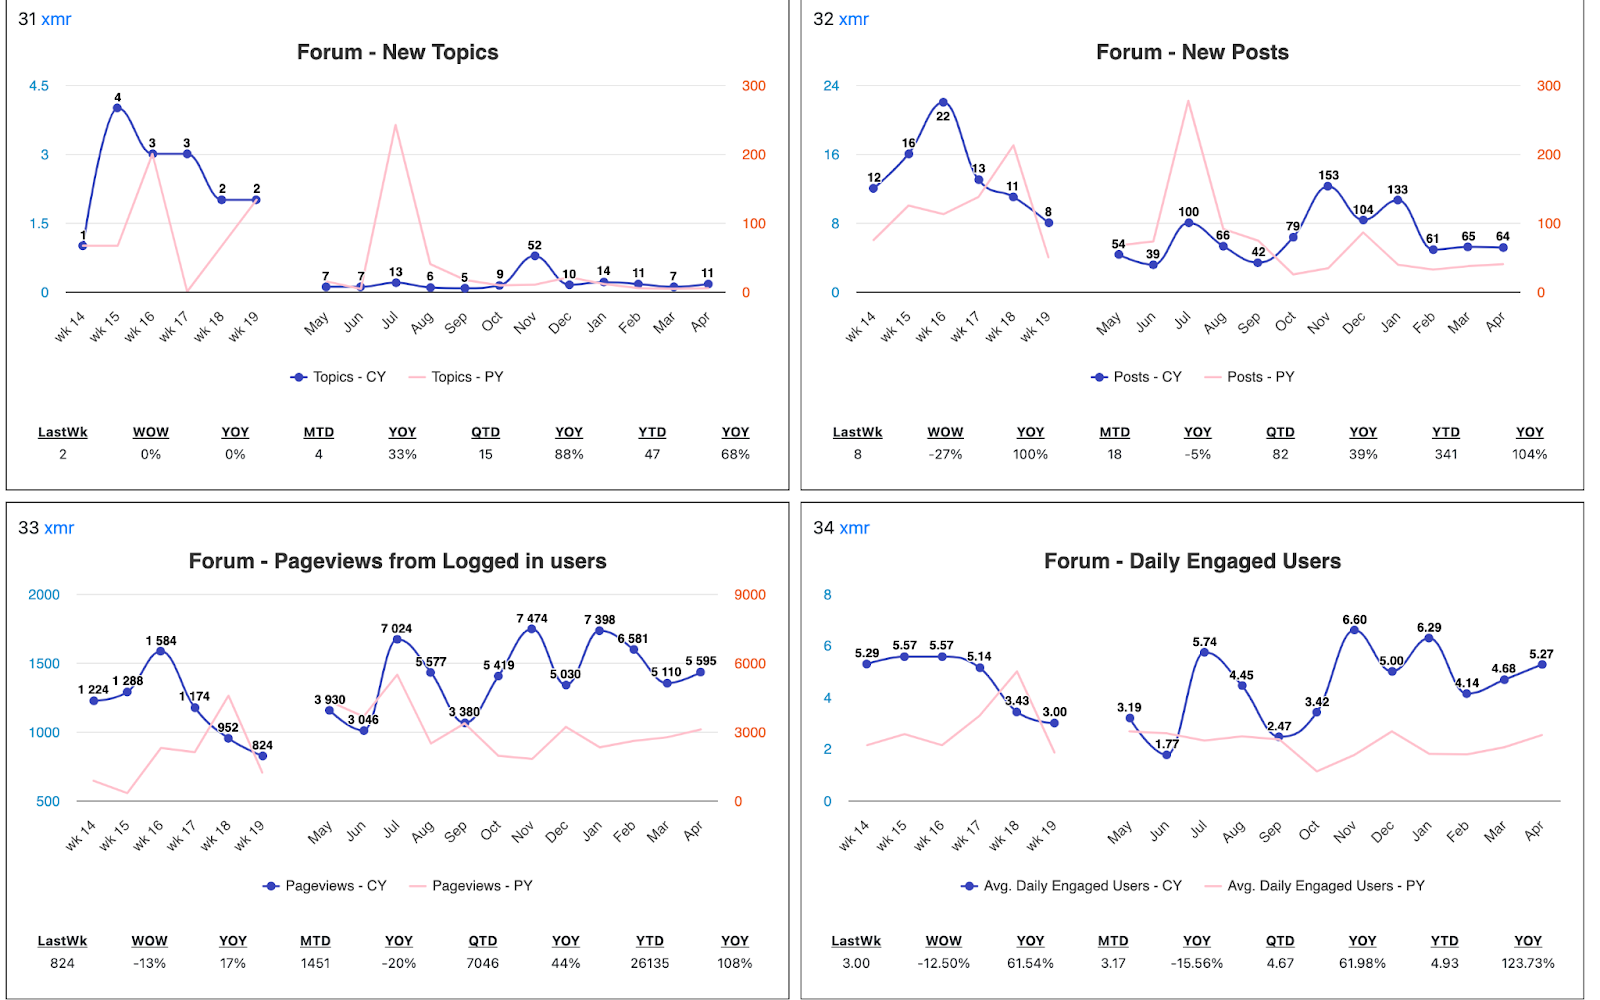
By far the most common visualisation is something called a ‘6-12 Graph’. It looks like this:
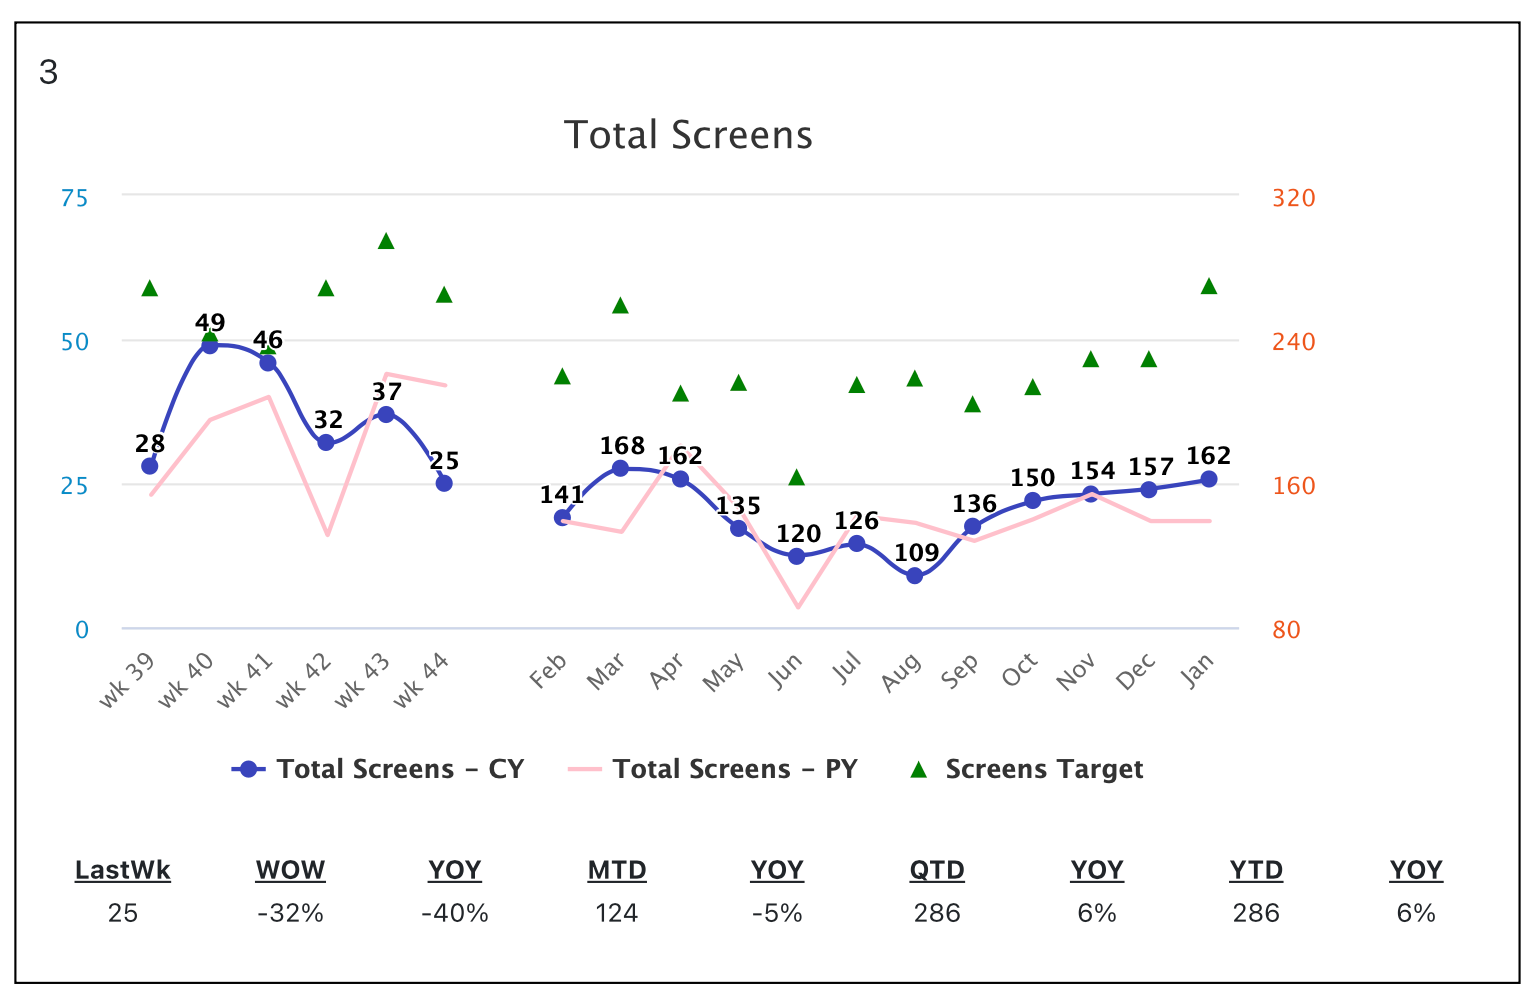
Notice the following properties:
- A 6-12 graph presents two graphs on the same X-axis. The graph on the left plots the trailing six weeks of data. The graph on the right plots the entire trailing year month by month. Six weeks is chosen because odd things can happen if you stop at a monthly boundary (i.e. four weeks). The graph on the left should be seen as a ‘zoomed-in’ version of the graph on the right.
- Numbers are presented on the line graph itself, following a data visualisation principle that is best explained by early Amazonian Eugene Wei.
- Each graph is numbered (top left) — which makes it easier to call out specific graphs during the WBR.
- The faded, pink line in the background is the same metric one year ago.
- The green triangles represent targets. This is set during the OP1/OP2 planning process, and are transformed to weekly values by the Finance department. Not every metric has a target.
- There is a list of numbers at the bottom of each 6-12 graph; these are referred to as ‘box scores’. They provide context for the past week’s number. The box scores are the same for every metric.
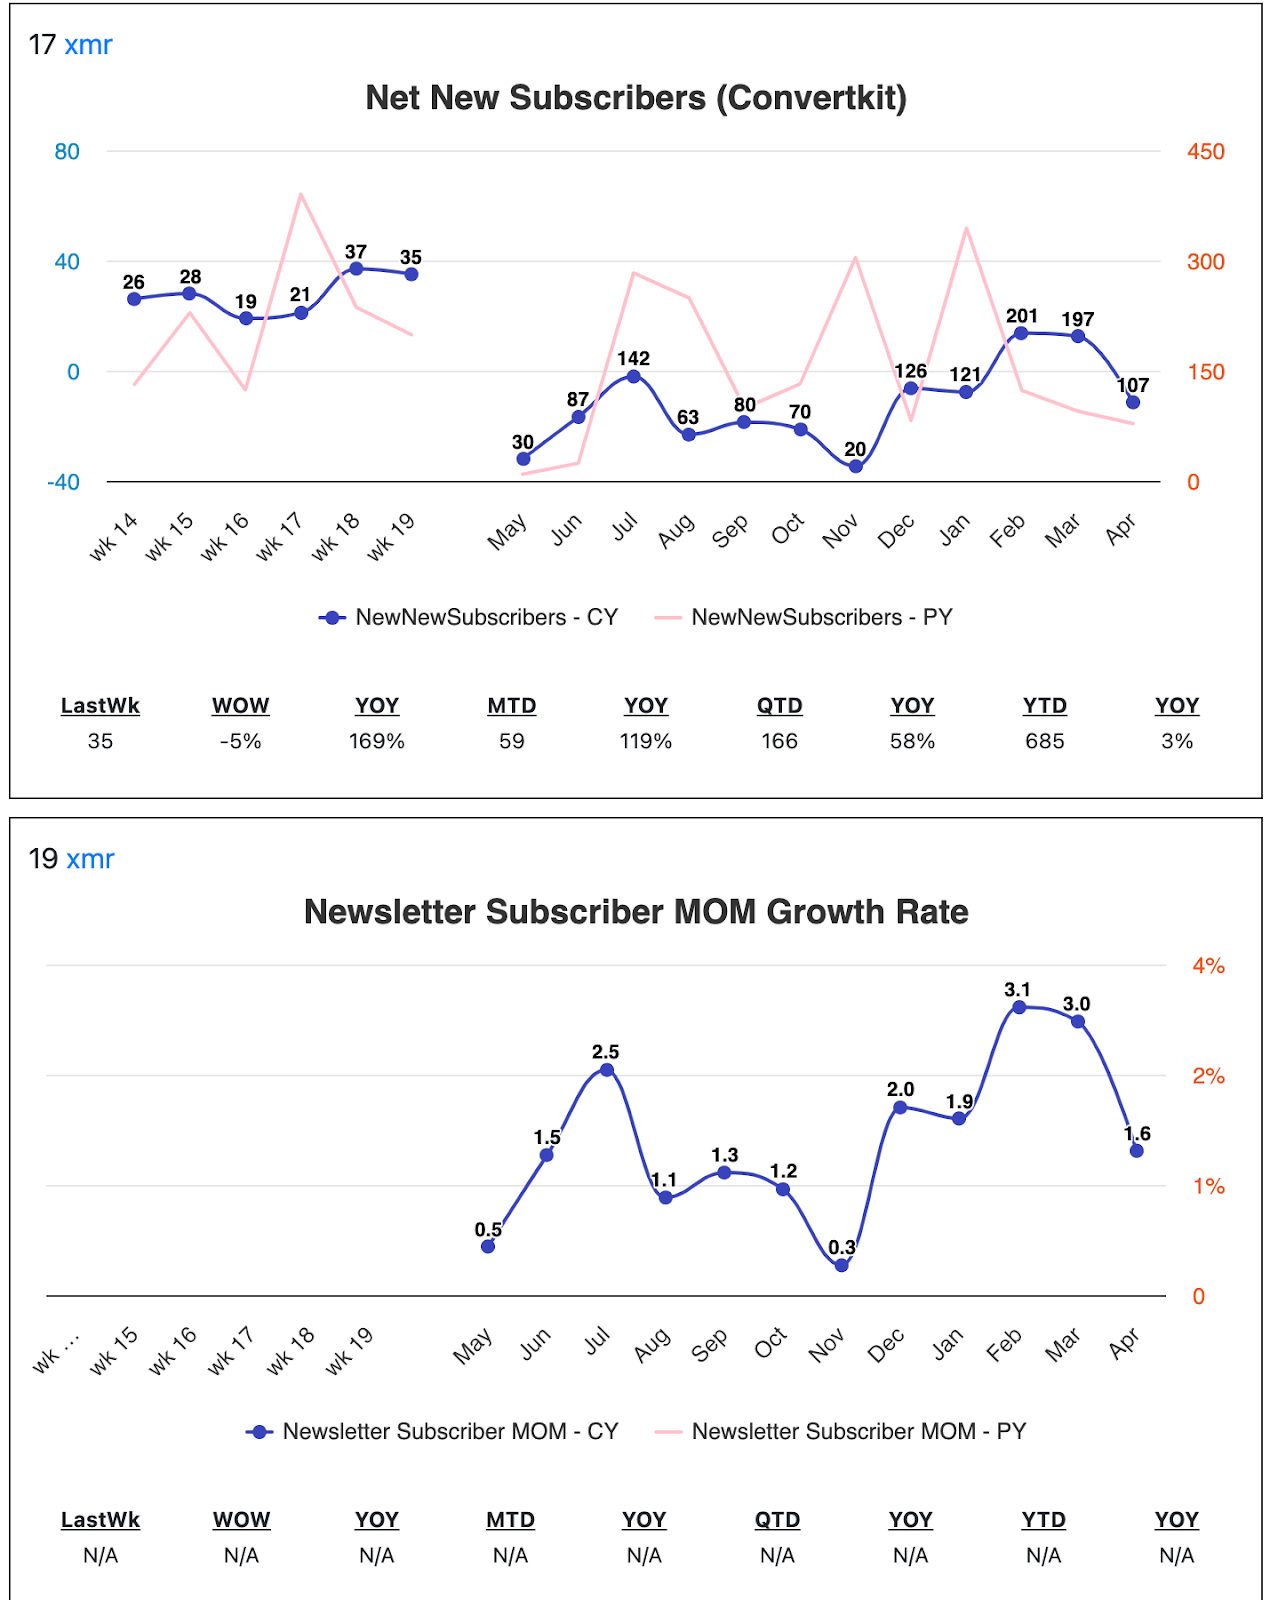
- Colin liked to say that at Amazon, absolute values were often not as important as rates. Many 6-12 Graphs displayed the growth rates of various metrics, typically next to the absolute value. Example below (this is only vertical because it’s how it appears in my WBR):
6-12 Graphs are used for nearly everything in the Amazon-style WBR. Controllable input metrics, financial metrics, % of visitors on iOS vs Android, you name it — it’s likely to show up as a 6-12 Graph.
If you’re like most people, you might feel overwhelmed when looking at a 6-12 graph for the first time — and you might not be able to stomach 400 of them each week. But over time, as you stick to doing the WBR over the course of months (and then years), the graphs will become trivial to read. An experienced WBR attendee should be able to go from graph to meaning within seconds. This is because most weeks, you won’t be looking at a graph for the first time — instead, you’ll be looking at the most recent week, in the context of the history of the metric over time. This is precisely the goal of the design.
The other two visualisation types are tables.
The 6-12 Table
Occasionally you may need to visualise more than two metrics on the same 6-12 Graph. Let’s suppose you run a cloud services business, and you want to track the latency of various cloud services for your top 10 customers. (“What did the customer experience last week?” you ask; latency is one facet of that experience when you’re providing a variety of cloud services.) Plotting 10 lines on a 6-12 Graph would be too much.
Instead, it makes sense to render this data as 6-12 Table. Here’s a sample 6-12 Table showing metrics for a hypothetical gym startup.
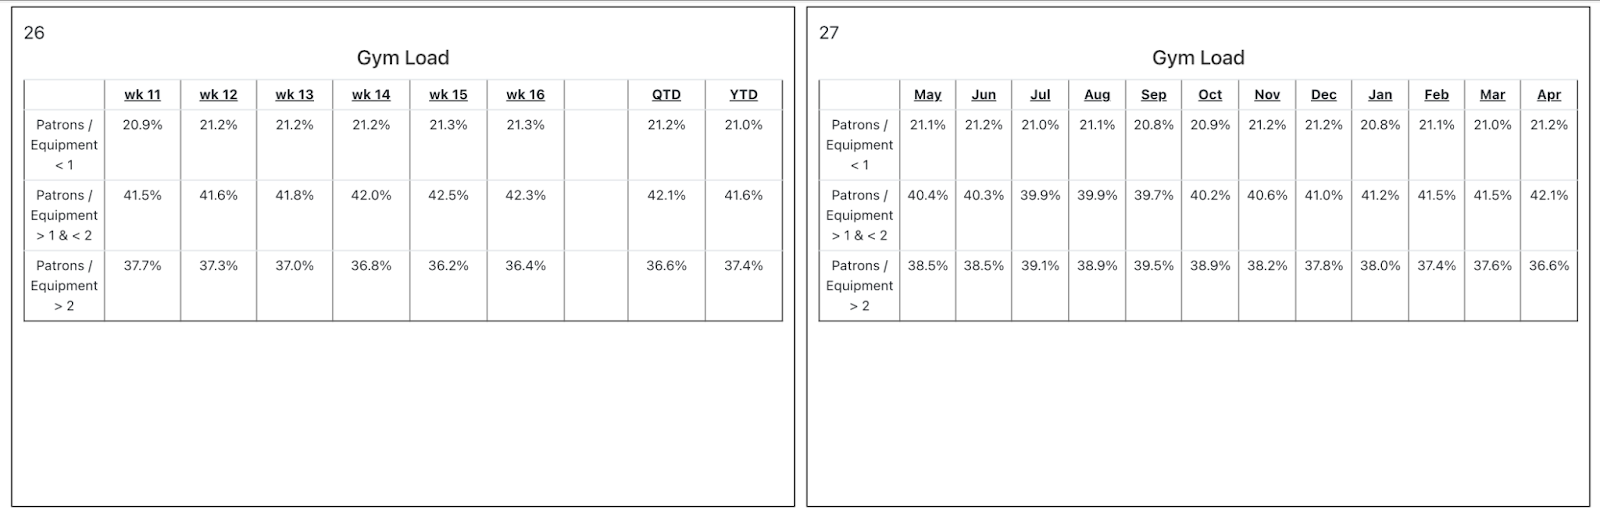
The purpose of 6-12 Tables are essentially the same as 6-12 Graphs.
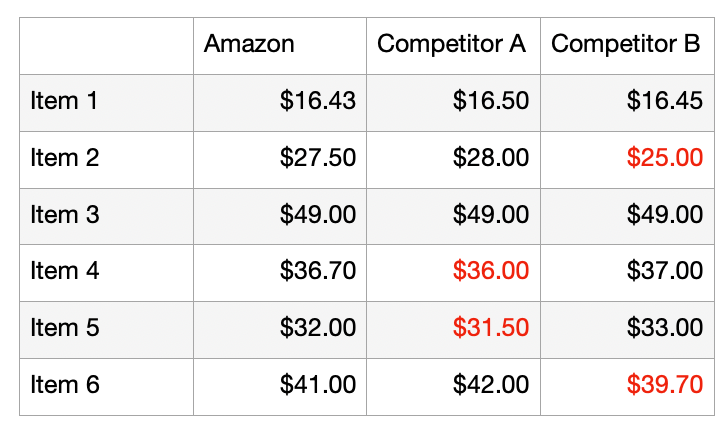
Plain Tables
The final visualisation type in an Amazon WBR is just a simple, plain table. Recall the earlier story about tracking how well Amazon’s prices stacked up against its competitors. This would have been presented as a plain table:
While there are only three visualisations here, this isn’t a hard constraint. If you need to come up with a new visualisation type, feel free to do so — but know that the fewer visualisation types you use, the easier it will be for you to build fingertip-feel for your data.
Metrics Composition of a WBR Deck
WBR decks are quite dense: when printed, you typically get four graphs to a landscape-orientation printed page. Here’s an example page from my own deck:
The expectation here is that the causal model of most businesses are complex, and that you will eventually have dozens if not hundreds of metrics in your deck. When you first start running your WBR, you should expect the number of metrics to increase rapidly as you uncover the real causal model of your business. Every output metric you care about will likely have multiple controllable input metrics. Which means that if you uncover a new controllable input metric, it makes perfect sense to include it in your WBR: you will want to track how well you’re driving things on a weekly basis.
At this point it’s worth dwelling on the nature of the WBR as a process control tool. Yes, the explicit goal of the WBR is to answer the three questions we’ve mentioned earlier in this essay. But we’ve discussed how process control forces teams to execute better, because they push operators to search for controllable inputs. This leads to an interesting use case for the WBR: if you want a particular business function to step up and shape up, you throw the WBR at it.
As a result, various parts of Amazon’s businesses are subjected to the WBR as-and-when they become relevant to top level strategy. In other words, the decision to include (or exclude) metrics in the top-level WBR is itself a mechanism to improve company execution.
Here’s one story Colin told me to illustrate this. In Amazon’s early days, the Amazon.com website was built around a central ‘catalog’. Changing the price of a single product demanded that you regenerate the entire catalog — a process that took a full day. This was terrible. It meant that category managers could not experiment with product pricing, as each pricing change demanded a 24 hour rebuild of the entire site.
Moving away from the catalog was clearly a top priority, and yet week after week dragged on with no change. One day, during an S-team meeting, Bezos demanded to know why the product catalog problem had not been fixed. After asking ‘why?’ a number of times, the S-team realised that recruiting was the root problem: Amazon was simply not able to hire new software engineers at a rate necessary for the catalog upgrade. At the time, every software engineer in the company was too busy fighting fires to keep the site up. (Bear in mind that this was in the late 90s; Amazon.com was not only one of the fastest growing websites on the planet, the technology and know-how to handle web-scale traffic didn’t exist).
Since recruiting was the root cause of this problem, Bezos decided to subject recruiting to process control: for months afterwards, recruiting metrics were presented at the WBR, and the hiring manager responsible for this team had to attend and present.
This was effective for a number of reasons:
- It lit a fire under the hiring manager’s ass, so that members of the hiring team would seek out controllable input metrics for each of their output metrics in order to hit their goals.
- It gave every other Amazon leader visibility into recruiting performance. Since recruiting often lay upstream of their goals, leaders throughout Amazon’s org would be able to make better decisions when allocating existing resources for their own activities.
I get the sense that recruiting became less of a problem over time, which meant that the number of recruiting metrics presented in the top-level WBR decreased once the crisis was resolved. But Amazon’s recruiting continues to run their own ‘departmental’ WBR (which consists of HR and the hiring managers of the operating teams). This is a good thing — it won’t surprise me if continual improvement applies just as much to recruiting as it does other aspects of Amazon’s business.
All of this to say that the WBR is more than just a metrics review meeting — it is also a potent operational tool. If you’ve got a functioning WBR, picking metrics to include at the top-level meeting sends a signal to the relevant org, and often prompts them to run a WBR of their own.
The Core Loop
To frame this differently, the core loop of the WBR looks like this:
- You add an output metric to your WBR. This output metric may or may not have a target attached.
- The team responsible for that output metric is incentivised to seek out changes that actually drive the output metric. Even if there is no target involved, there is immense social pressure to do so, because they have to present to leadership every week.
- The team goes through an iterative, trial and error process to figure out the right process improvements to influence that output metric. (The process improvements are instrumented, and if proven to work, are added to the WBR as controllable input metrics). Because the WBR runs every week, this iterative process is visible to WBR attendees.
- You bring this area of business under control and move on to the next output metric you care about, and everyone who attends the WBR builds better intuition about what works. Rinse and repeat.
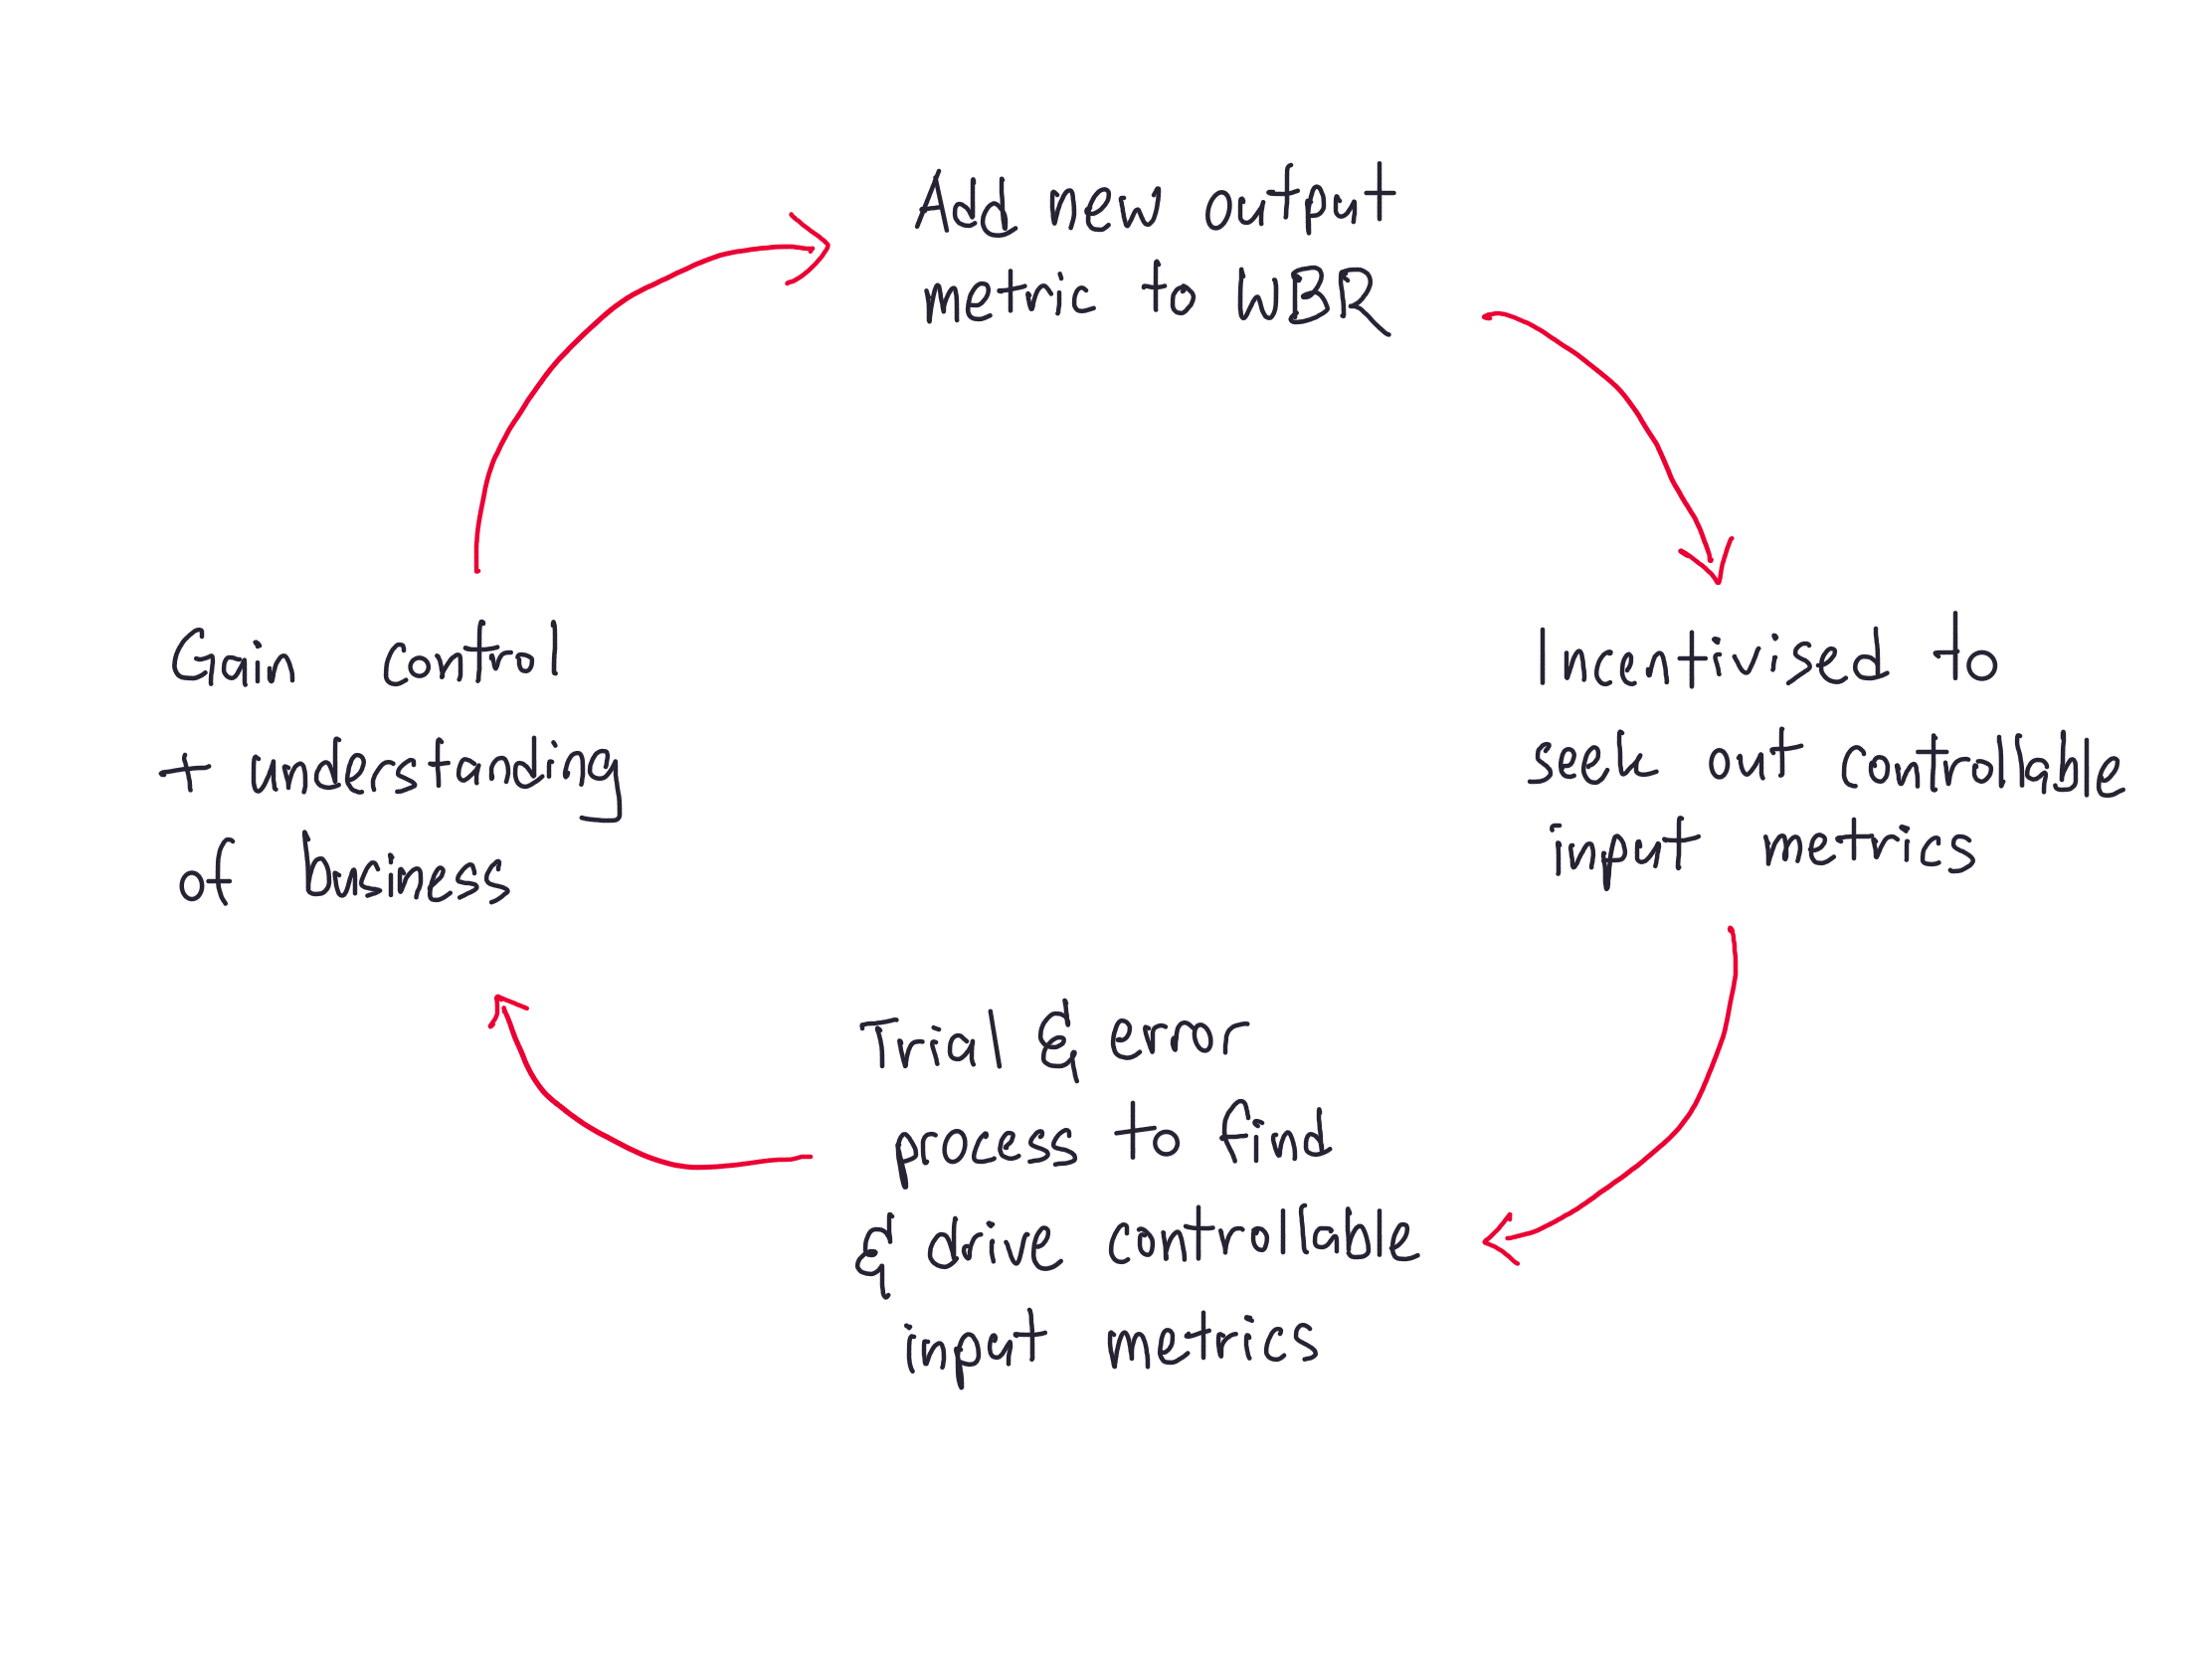
Eventually every business leader knows what actually drives business outcomes, for every part of the business. And they know it because they’ve seen so many loops run end-to-end.
How to Come Up With Controllable Input Metrics?
At this point, a natural question to ask is “ok, I know what output metrics I care about. How do I find controllable input metrics for each output metric?”
When I asked Colin this, I said something like “do you expect operators to … guess?” To which he replied: “No no, good operators don’t guess! If you’ve been running a business successfully, it’s likely that you already have a good sense for what affects your business. You should go measure those things, and then drive them to see if the relationships (to the corresponding output metrics) are real.”
I can say now — given the months that I’ve spent putting the WBR to practice — that this is broadly correct. But I’ll add that there are a few other situations that give you controllable input metrics:
- If you observe positive exceptional variation in your metrics, you should investigate to see what caused the spike, and then start an initiative to try and replicate it. If that activity is repeatable, you should come up with a set of controllable input metrics you can track to drive it.
- Sometimes, when asked “How is this measured?” a metrics owner will say that a particular metric consists of some other set of metrics. To which an Amazon exec might say: “well, why don’t we add those to the WBR then?”
- If you observe negative exceptional variation in your metrics, you’ll want to investigate to see if this is a process failure you can avoid in the future. And if there’s something measurable there, you’ll want to add that to your WBR.
Colin told me that whenever a blowup occurred, Bezos would often ask: “What is something that we could have been tracking that would have allowed us to avoid this blowup in the future?” That metric, more often than not, would be added to the top-level WBR.
The Most Common Questions During a WBR
At Amazon, the three most common questions during a WBR are the following:
- Is this metric worth discussing? If it’s an output metric, we’re just wasting time discussing it. We need to figure out what the input metrics are first.
- If this is a controllable input metric, is this the right input metric? Because often there are multiple proxies we can use for the thing we want to measure.
- Finally, assuming this is a controllable input metric and the right metric, how is it measured?
These three questions sound simple enough, but I want to draw your attention to the kind of thinking necessary to ask these three questions on the regular.
- ‘Is this metric worth discussing?’ stems directly from the process control worldview: that is, the goal of data is to help you uncover the control factors (aka controllable input metrics) for each process in your business.
- ‘Is this the right input metric?’ assumes that a measurement is always a compression of reality. Therefore, measurements are lossy. Why is this so? Well, it is often the case that you want to measure something that isn’t directly measurable. For instance, let’s say that you want to measure customer satisfaction. In an ideal world, you would use telepathy to read your customers’s minds. But that clearly isn’t possible! Instead, you’ll have to use other — imperfect — measures like NPS surveys or % repeat orders to get at ‘true’ customer satisfaction. This means that for any given phenomena you wish to measure, there are typically multiple possible metrics to select. This selection process should be discussed within the WBR itself, as part of an acculturation process, to spread this type of thinking throughout your entire business.
- ‘How is this measured?’ gets at something fundamental about the nature of measurement. You can only tell if you are getting at some facet of reality if you know how you are instrumenting that phenomena. Every metrics owner in Amazon is expected to be able to answer this instrumentation question during the WBR (this is, again, an expression of the Amazon Leadership Principle ‘Dive Deep’). The question is so important that we have spent an entire essay in the Becoming Data Driven Series on defining metrics, just to talk about defining your measurements. To quote SPC expert Donald Wheeler: “A particular method may do a better job, or a poorer job, of counting people in a given segment of the population than will an alternative method. Nevertheless, there is no way to claim that one method is more accurate than another method. The number you get will be the result of the method you use (emphasis added).”
The Importance of Epistemology
Why are these three questions so important? I think they are important because they get at something that we don’t talk much about when we talk about becoming data driven.
One thing that has struck me repeatedly as I talked to Colin (and, over the course of the subsequent months, other ex-Amazonians) is that there seems to be a remarkable amount of good epistemology at the very top of Amazon.
Epistemology is a fancy word that means “how do you know that what you believe is true?” The three questions are perhaps a good indication of this — it’s not often that you hear leaders digging deep into metrics and demanding to know what alternative measures exist, or repeatedly asking how things are instrumented. But when I first started putting the WBR to practise in my own context, I quickly realised that epistemology is a more important aspect of using data than I first thought.
You may have come into this essay thinking that the WBR is simply a collection of battle-tested techniques for becoming data driven. And that is true — I’m willing to bet that you’ve gotten several new ideas by this point in the essay. But there is another fact that we must acknowledge: in reality, how effective you are at using data — even with the structure of the WBR — is only as good as your understanding of the forms of knowledge data can give you.
Data is not a panacea. There are limits to the knowledge you will gain from your metrics. For instance, one question that nearly everyone asks is “how do I know if such-and-such a marketing campaign has worked — given all the other campaigns that are running concurrently?” In other words: “will the WBR give me perfect marketing attribution?”
And the answer — of course — is no, it won’t. What’s most likely to happen in the context of the WBR is that you will say something like this: “When we ran X marketing campaign, we wrote a doc where we predicted it would take around five months for the impact to show up in our output metrics P, Q and R. At the five month point we saw nothing, so we decided to wait for another two months. We think it’s starting to work now. Metrics P and Q are showing a lift in growth rate that can’t easily be explained by other concurrent initiatives. We don’t know for sure, but based on our understanding of the customer and of our business, we think the most logical explanation is marketing campaign X. We think we should expand the campaign. Joe thinks we should run one more A/B test for certainty, in one of the smaller countries. Mary is confident that this growth is the result of the X campaign, and is willing to go ahead without running more tests. Mary tends to get things right; we’re willing to go with her judgment.”
Notice that this can only happen if you’re looking at metrics often enough to know what a ‘normal’ growth rate looks like. And notice, also, that ‘Mary’ has had enough good calls under her belt to justify trust in her judgment. Using data to make decisions is not the coldly analytical thing that data-vendor content marketing makes it out to be. There’s often a great deal of gumption and human judgment involved.
Here’s another example. Throughout the time I was working with Colin, he kept emphasising that anything quantitative needed to stem from a ‘deep qualitative understanding of the customer’.
“You don’t want to draw naive conclusions from your data,” he would say, “You’ll want to use your understanding of the customer to test hypotheses using data.”
This might seem like a subtle distinction. To Colin, drawing ‘naive conclusions’ included things like taking correlations in your data at face value, or naively using customer surveys (in isolation) to conclude things about your customer. But then I ran it by a researcher friend, and he told me that “yes, duh, this is scientific method 101.”
I said I didn’t understand.
“Look, let’s say that you have some data set, and then you find a correlation between two variables. You find, say, a link between eating white rice and cancer. Do you publish?”
“Err, no,” I said, thinking back to an old xkcd comic on green jelly beans and acne. “I know that doing that is bad, but I don’t know why.”
“Just because a relationship exists in some existing data doesn’t mean the relationship is real. It could be a spurious correlation. An accident of the sample. You need to run a new experiment, collecting new data, to verify that the relationship is real.”
“Right …” I said.
“To put this another way, you know in machine learning you need to train your model on some training data, and then evaluate it on some new data it’s not seen before? That the evaluation data has to be separate from the training data?”
“Yes.”
“Well, same principle! If you evaluate your model on data it’s been trained on, you risk having a model that’s overfitted to the training data. Ideally you collect some new data in the real world, and evaluate your model based on that.”
“So what this means in a business context is that if I find a relationship between two things — like, say, I find that average session duration goes up after launching a new section of my site, I cannot accept that as a truth yet? I will need to —”
“Run an experiment? Yes. You’ll need to funnel more visitors to that section of the site, and see if it actually increases your average session duration, more than your current range of values. You must test to establish causality.”
At which point I finally understood what Colin was trying to say.
But now, consider: Amazon’s top leadership — all those businesspeople sitting in the S-team — had this understanding baked in even as they iterated on their WBR. The format of the WBR can be taught. The software used to automate deck generation and data collection can be built. But how difficult is it for you to train your executives to think like this?
And, for that matter, how effective do you think your executives would be, if given an equivalent data tool today?
I’ll leave these questions as an exercise for the alert reader.
Invisible Benefits of the WBR
At the top of the piece I mentioned that the WBR has three explicit goals (the three questions) and several more … implicit ones. Let’s talk about the less explicit goals now.
Some of these things we’ve actually already discussed over the course of this piece. For instance:
- The WBR can be used as a mechanism to get certain parts of your org to shape up. In this view, it is a ‘process control tool’, less a simple ‘metrics review meeting’.
- The WBR is a mechanism to distribute data culture throughout your organisation. If leadership consumes and thinks about data in a certain way, you can be sure that this style of thinking will spread throughout your company. This is especially true when performance evaluations are tied to metrics presented in the WBR process.
- The WBR is (yet another) mechanism to enforce the ‘Dive Deep’ leadership principle — and is quite potent: it serves as a weekly reminder to Amazon’s leaders and metrics owners. You do not want to appear like you’re not on top of the details of your own business, especially when presenting to your peers.
- Because the WBR examines the business end-to-end, it gives your executive team a shared mental model of the entire business. This helps with breaking down silos, but it also gives your executives better context, which in turn helps them make better decisions in their own departments — as we saw with the story about recruiting, above.
On that last point, while it was clear how recruiting might affect the goals of downstream departments, it wasn’t clear to me why the leader of Amazon’s e-commerce business, say, should need to know the state of Amazon’s cloud business (or vice versa). But there are intangible benefits to having leaders across a company keep track of what’s happening elsewhere in the business, even if each department isn’t directly related. If done well, the WBR can be a tool to create a culture of “we’re all in this together” — especially given how all of Amazon is incentivised using long-term equity grants.
There are a couple of other benefits to the WBR that we haven’t talked about yet. Let’s talk about them now.
The WBR is a mechanism to defend against Goodhart’s Law.
Goodhart’s Law states “when a measure becomes a target, it ceases to be a good measure.” In a previous essay, we’ve already discussed how the WBR serves as a defence mechanism against Goodhart’s Law. The key idea is that if you incentivise controllable input metrics, you can catch when an input metric stops affecting the output metric you care about, or if it starts producing negative effects elsewhere in the company. The structure of the WBR helps when defending against Goodhart’s Law because it takes into account a more actionable version of the law, something I call ‘Joiner’s Rule’:
When people are pressured to meet a target value there are three ways they can proceed:
1) They can work to improve the system
2) They can distort the system
3) Or they can distort the data
The key bit that I want to point out in this essay is that the WBR functions as a safety net: if you have a review meeting every week, you’re slightly less worried about controllable input metrics going astray, since you have a weekly checkpoint to a) observe distortions across other departments in the company, and b) make adjustments to the metrics you are incentivising. Again, I recommend reading the original essay for the full explanation; it goes into detail on how the WBR is structured to reduce the effects of Goodhart’s Law. This includes innovations like giving Finance total power to audit metrics across the company. (“Regardless of whether the business was going well or poorly, the finance team should ‘have no skin in the game other than to call it like they see it,’ based on what the data revealed.”)
The WBR enables innovation
One aspect of the WBR that might not be obvious is that it actually enables innovation. I did not realise this, perhaps because I haven’t been doing the WBR for nearly long enough. But Colin called this out when reviewing a draft of this essay. He wrote (all bold emphasis mine):
There is one other thing that the WBR (and other ways in which Amazon leaders consume data) does well. When you operationalize input/output metrics through the WBR, you now have the raw material for what innovations to do next. As Jeff [Bezos] used to call it, you are swimming in the data each week. Since that data captures the customer experience, you can't help but feel the pain points of your customers and subsequently can't help but think about innovative ways to improve. I often get asked the question of how Amazon innovates so well. Creating an environment where everyone swims in the data that reflects the customer's point of view is a big reason.
So, WBR = continuous improvement + innovation that matters to customers. That's a powerful combination.
Colin, it should be said, was present for the creation of Amazon Prime, Amazon’s Affiliates program, the Kindle, the Fire Phone, and AWS, amongst other things. He should know a thing or two about innovation.
The WBR allows you to communicate a complex causal model of the business to your leaders.
We’ve already talked about how the WBR helps you build and then distribute a causal mental model of the business to your entire executive team. But I want to talk a little about the nature of that causal model.
Why have we spent so much time talking about the format of the WBR? Surely there are easier ways of running a metrics meeting? Surely the density of the format is too much to bear? The answer is that every feature of the WBR is designed to let you encode a complex causal model into something that can be consumed in a short amount of time. Commoncog’s WBR currently has 47 metrics (including Xmrit’s metrics — which we launched only a few months ago); during our meetings we finish our metrics review in less than 15 minutes. We don’t use all of Amazon’s WBR practices. If we did, we would probably finish in ~5 minutes.
Amazon does not have 400-500 metrics in their WBR because they want to show off. They have 400-500 metrics because this represents the number of levers available to them to run their business. Yes, their business is complex. The number of metrics they review in their WBR reflects this complexity. Commoncog’s business is stupidly simple by comparison. But Commoncog’s business — as simple as it is — still takes 47 metrics to represent end-to-end (and we’re constantly iterating). I would wager that your business will have more metrics than a measly 47.
Most companies do not have the capability to present more than a handful of metrics to their executives. This is why you will hear bromides like “don’t look at too many metrics” or “follow the North Star metric framework: find the ONE metric that matters.” Having read this essay, you should ask yourself: is it really true that the causal model of most businesses is representable using just one metric? Or even just a handful of metrics?
Perhaps it is more likely that executives are just looking at a tiny subset of metrics because that’s all they can handle. If that is the case, then most companies simply have to settle for something that represents a low-resolution picture of their business. This is not a good thing.
The format of the WBR matters, I think, because it enables you to examine more metrics in the same amount of time. This quantity is not a minor thing. It is central to what makes the WBR powerful: because you can examine more metrics, you have the capability to manage a richer causal model of your business. Or, in the case of Amazon, you can use this capability in a more ambitious manner: you can manage a more complex business. To quote Bryar and Carr, in Working Backwards:
Both of us moved on from Amazon to pursue new endeavors—Colin in 2010 and Bill in 2014—but we were forever shaped by our Amazon experiences. We worked with a variety of companies and investors in venture capital. Typical of the kind of thing we heard in our work was this remark by the CEO of a Fortune 100 company: “I don’t understand how Amazon does it. They are able to build and win in so many different businesses from retail, to AWS, to digital media. Meanwhile, we have been at this for more than 30 years, and we still haven’t mastered our core business.”
Sure, you can’t share the WBR with everyone in your company and expect them to understand the causal model that’s represented by the metrics. The links between metrics in an Amazon-style WBR deck are quite tacit; you really have to attend the meeting to understand which metric links to which other metric. You should probably hesitate before showing your WBR deck to your board, much less outsiders.
(I should note that early Amazon had a simpler model of their business that they use for communication to employees: this was The Flywheel).
So perhaps it is ok to present a simplified model of your business to your board, or to your rank-and-file. Your leaders, on the other hand, should know the full causal model of the business. They’re flying the damn plane, after all. You should give them the richest instrument panel possible.
What is Hard About All This?
Let’s close this essay with a final question: what is hard about all of this?
There is a lot that can go wrong with the WBR. In Working Backwards, Bryar and Carr took some time to outline one particular failure mode:
One large software group, run by a senior leader who is no longer at Amazon, had memorably rough WBR meetings. Learning and taking ownership of problems and their solutions were two important goals of the WBR process, and on that front these meetings were a huge missed opportunity. They wasted a lot of everyone’s time.
One issue was that the attendee list got more and more bloated, and we had to keep finding bigger conference rooms to fit everyone. Likewise, the number of metrics we were trying to track kept ballooning—sometimes for the better, but more often for the worse.
The meetings were also just really unpleasant. There was a lack of ground rules and decorum, with quite a bit of interruption and sniping. Any anomaly was blood in the water, with accusatory questions fired at the presenter. The conversation would quickly regress, as multiple people, usually with little to add, would chime in—seemingly to show off, or to curry favor. Worse yet, some of these lengthy asides seemed to be aimed at running out the clock—with the speaker extending unproductive conversations before their own area would come under fire.
I’ve spent nearly no time talking about the various social aspects necessary to make the WBR succeed. Yes, I’ve alluded to its importance — earlier in this essay I mentioned that I’ve learnt that the social bits are more important than the technical bits when getting the WBR to work. I should also note that Bryar refuses to teach any executive team who isn’t fully committed to the practice of the WBR. To get the WBR to work, you need to have a prevailing culture of truth-seeking — which in most organisations means you must make an effort to build such a culture.
Bryar and Carr continue (emphasis mine):
What should we have done? Even though, as we’ve mentioned, there is no one person running the meeting—different people take over for different slides—the most senior person should be responsible for setting the tone and ground rules every week. That person should also, in this case, have limited attendance to owners and key stakeholders, and also limited the metrics to be reviewed to a specific, essential set: irrelevant metrics should have been deleted from the deck. All of us leaders of that software group, not just that one individual, should have examined the meeting as relentlessly as the participants were examining one another. Collectively, we should have recognized that many of the areas being measured were not yet operationally under control and predictable. Many of the teams had skipped the first three DMAIC steps—define, measure, analyze—in an attempt to operate at the Improve stage. They ended up chasing blips on a graph with not much to show for their effort. We should have—politely and constructively!—recommended they do the necessary legwork to convert their metrics from noise to signal.
Last, we should have recognized that implementing a WBR for this new group for the first time was bound to be messy, requiring trial and error. In the end, we should have ensured that attendees felt free to talk about their mistakes and were actively encouraged to do so, allowing others to learn from them. The key to these meetings is to create a balance between extremely high standards and an atmosphere where people feel comfortable talking about mistakes.
Note that ‘under control and predictable’ means ‘under routine variation, with no exceptional variation observed’. We have discussed what it means to do this elsewhere in the Becoming Data Driven series.
I can’t go through all the various ways a WBR may fail. There are certainly plenty of political aspects to it that make it difficult to talk about in the abstract. But I know this much is true: you need total buy-in from company leadership to get a WBR process to take. Anything less will not succeed. And you need to set the tone right from the beginning, so it doesn’t turn into an adversarial thing.
I’ll leave you with one last observation.
The WBR is an extremely heavy lift. It assumes you are willing to work at a certain operational cadence, and that you are willing to get at the truth. I happen to know this because I’ve implemented it: it took me months to get started, it took me months to understand how to do it well, and it took me months to see results.
Colin has always said that he didn’t mind if we released large portions of the WBR process to the public. The problem with the WBR isn’t the mechanical details of doing the meeting. That is easy to articulate, as I have just done in this essay. It’s not even the software that is difficult — Amazon ran their WBRs using Excel in the early years, and printed every goddamn deck on paper.
No, the problem with the WBR is organisational discipline. It takes a certain amount of operational rigour to compile, examine, and then test a causal model of your business each week. It takes rigour to hold yourself to a high bar of excellence, facing uncomfortable truths early on by looking, unflinchingly, at your numbers, and iterating — always iterating — on your business.
I thought I was a decent operator when I first met Colin. Now I know that I am merely average. But — and this is important, and should perhaps be inspiring — I can see a path to becoming as good as he is.
The WBR is the reason why.
Further Resources
If you’d like to view a full WBR deck, click here: Sample B2C WBR Deck.
Check Out Working Backwards
Colin Bryar and Bill Carr run a consulting practice called Working Backwards LLC. They help large companies and select startups with implementing the WBR, and are responsible for nearly all the ideas you read here.
Check out their resources page, contact them for a speaking event, or buy the book.
Originally published , last updated .
This article is part of the Operations topic cluster, which belongs to the Business Expertise Triad. Read more from this topic here→