

The answer, like most things from Statistical Process Control, is more surprising and more obvious than you might think.
This is Part 2 of the Becoming Data Driven in Business series. Read Part 1 here.
Donald Wheeler’s Understanding Variation opens with a cute story. It goes something like this:
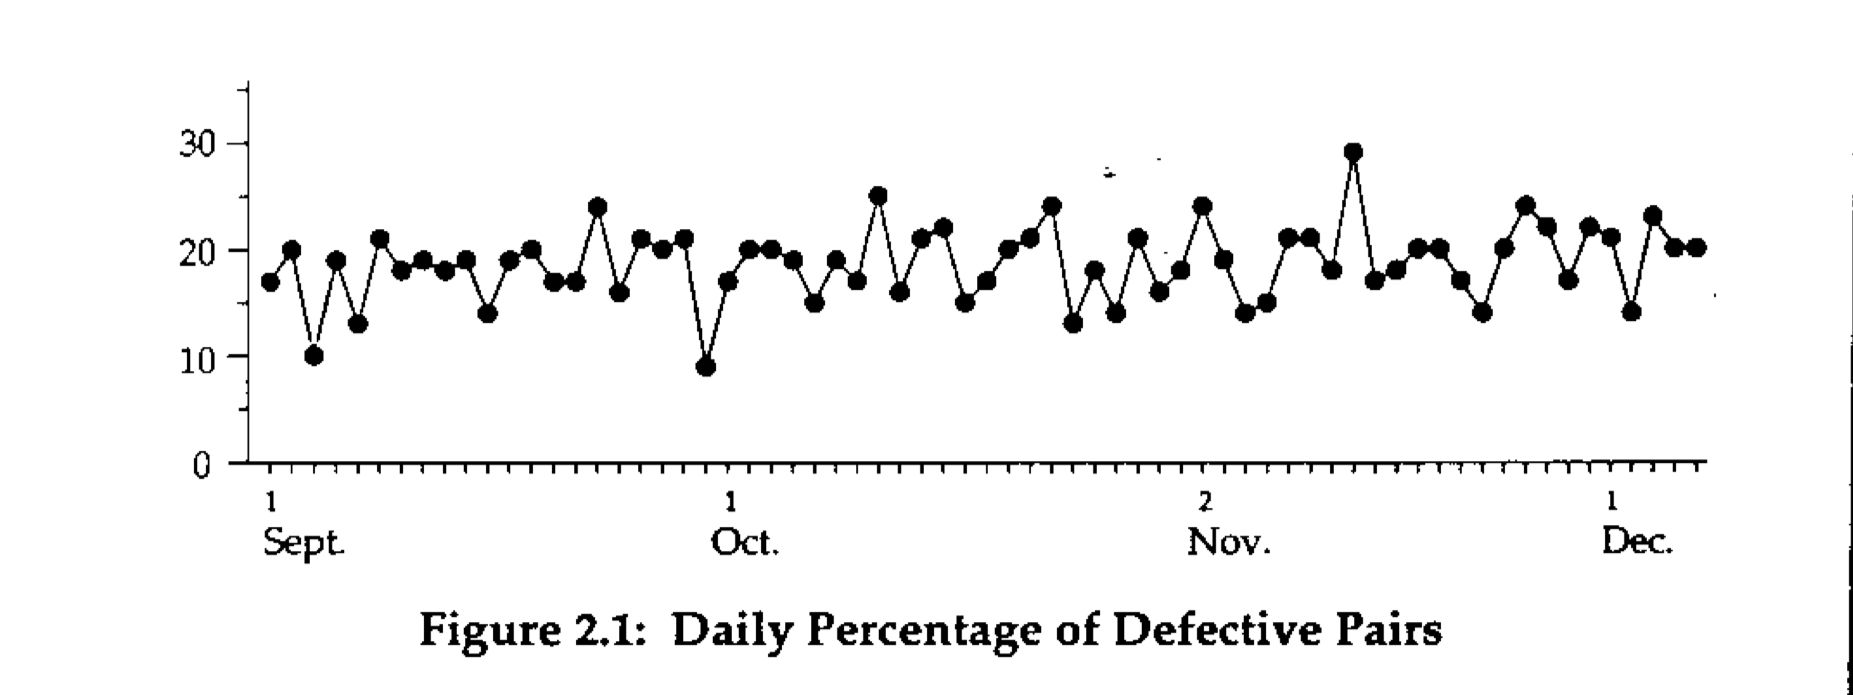
Many years ago, David Chambers found the following time series on the wall of the office of the president of a shoe company. Here was a simple and powerful presentation of data in context. The caption on the vertical axis was “Daily Percentage of Defective Pairs.”
Intrigued, David asked the president why he had the graph on the wall. The president condescendingly replied that he had the chart on the wall so he could tell how the plant was doing.
David immediately responded with “Tell me how you’re doing.”
Evidently no one had the temerity to ask the president this, because he paused, looked at the chart on the wall, and then said, “Well, some days are better than others!”
My bet is that you’ve probably experienced something similar. How many times have you opened a tool like Google Analytics, looked at the number of website visits, and said to yourself “oh I guess some weeks are better than others?” How many times have you then turned to the overall trend of visitors, say over a period of months, just to reassure yourself that the number is tracking upwards and that all is good with the world?
Many times, I’d bet.
The honest truth is that if you are like me, you probably never know what to do with this information. You don’t know what drives the number up some months, or what to do when the number goes down in December, or what to think when visits have dipped for three weeks in a row. This is, bar none, the most common experience people have with data. And if you’re like most people — myself included — you’ve probably never been taught how to interpret things differently.
My hope is that we’ll be able to change that with this essay.
Listening to the Voice of the Process
In our previous piece we took a look at Goodhart’s Law, and examined how Donald Wheeler’s Understanding Variation contains a method for dealing with the Law in various organisational contexts. In the middle of that piece, I quoted the following bit from Wheeler (all emphasis mine):
Before you can improve any system you must listen to the voice of the system (the Voice of the Process). Then you must understand how the inputs affect the outputs of the system. Finally, you must be able to change the inputs (and possibly the system) in order to achieve the desired results. This will require sustained effort, constancy of purpose, and an environment where continual improvement is the operating philosophy.
Comparing numbers to specifications will not lead to the improvement of the process. Specifications are the Voice of the Customer, not the Voice of the Process. The specification approach does not reveal any insights into how the process works.
So if you only compare the data to the specifications, then you will be unable to improve the system, and will therefore be left with only the last two ways of meeting your goal (i.e. distorting the system, or distorting the data). When a current value is compared to an arbitrary numerical target (... it) will always create a temptation to make the data look favourable. And distortion is always easier than working to improve the system.
At the time, I said that Wheeler was trying to make a point about the impossibility of improving a process if you focused solely on stated goals. His name for goals (or other kinds of specifications such as, for instance, a budget) was the ‘Voice of the Customer’; his name for observing the process itself was “listening to the ‘Voice of the Process’”. I explained that Wheeler was arguing for listening to the Voice of the Process — which is really a counter-intuitive notion, since our natural inclination is to focus on targets. But hidden in that passage lies the solution to our current problem.
It turns out that Wheeler meant something very specific when he said “you must listen to the Voice of the Process.” He was talking about a particular approach to working with data — one that generalises rather broadly to all forms of business activities. That approach goes something like this:
Nearly any chart that you look at is the result of some ‘process’: a website visitors graph in Google Analytics, for instance, is the output of some combination of traffic sources bringing readers to your website, which is in turn the result of a complex mix of your marketing activities, your search engine site performance, some amount of link sharing on social media, and perhaps the number of people who decided to search for keywords that you ranked for in that specific month.
The process control approach to data is to go, “ok, a time series of visitors is a report on the performance of that process in a given month. So we need to ask, like, three obvious questions, right?”
Those three obvious questions:
- Have you successfully changed the process? In the specific case of website visitors: are your marketing activities working? Have they resulted in permanent change in the underlying complex mix of sources, such that you see a permanent increase in your visitor numbers?
- Has something else changed in the underlying process? For instance, a major celebrity might have linked to your website, causing a massive short-term spike in visitors, followed by a permanent boost in traffic. Conversely, your second largest source of traffic might have changed its outbound link policies, reducing its total contribution to your visitor numbers. Both are things that you might want to know about, and preferably sooner rather than later.
- Finally, and perhaps most importantly: are the current changes in your visitor numbers totally normal, and therefore just routine variation? In other words, should you just ignore the changes in visitor numbers this month? There is, after all, nothing quite as depressing as being forced to write a made up report about why marketing qualified leads (MQLs) is down for the current month, when it could just as easily be explained by routine seasonal variation.
If you boil these three questions down to their core, what you end up with is a radical, almost laughably simple idea: telling the difference between routine versus exceptional variation is the beginning of becoming data driven. Statistical process control practitioners would even go so far as to say that it is impossible to be properly data driven if you do not fully understand variation. And I will admit to having great difficulty with this idea — the very notion that understanding variation lies at the heart of data-driven decision making was such an alien notion, such a radically dumb, simple idea, that it took me awhile to grasp its importance (“Surely this entire book can’t be about variation right? Right? Right? Wrong.”) Perhaps this shouldn’t be so surprising: you cannot investigate changes in your underlying process if you do not know which data points signal real change. Worse, you will waste huge amounts of time if you investigate every instance of ‘oh no, number go down’.
So let me attempt to drive this point home by restating this idea, albeit more strongly. The field of statistical process control (SPC) was founded on the ideas of American statistician Walter Shewhart, and spread through the work of W. Edwards Deming during and immediately after World War II. Deming liked to say that every instance of exceptional variation is an opportunity for process improvement. If you see positive exceptional variation (a massive visitor spike, for instance), you’ll want to investigate because such a spike will tell you something insightful about the underlying process; if you see negative exceptional variation (a sudden dip in visitor numbers, say), you’ll want to start digging into the causes that produced that dip, hopefully before it becomes too large of a problem.
But there are actually many more implications when you start to see variation as ‘routine vs exceptional’, and we’ll get into those in a bit.
Originally published , last updated .
This article is part of the Operations topic cluster, which belongs to the Business Expertise Triad. Read more from this topic here→
The thought of business school make you go ‘eww’?
You’re in good company.
9,000+ investors and operators read Commoncog to sharpen their business acumen ... WITHOUT going back to school.
Sign up for our newsletter and get a weekly dose of good business thinking (no BS guaranteed):