

Note: this is Part 11 in a series of blog posts about becoming data driven in business. You may want to read the prior parts before reading this essay.
At the start of this series, we were introduced to the idea that ‘understanding variation is the foundation to becoming data driven.’ This makes intuitive sense: if you cannot tell when some change in data you’re looking at is the result of routine variation or special variation, then — in effect — you cannot tell signal from noise, and are unable to investigate changes in your business effectively.
But there is one other, foundational, aspect to data that I did not fully appreciate. That aspect is this: there are two distinct environments in which data analysis occurs.
- Some data are the result of an experiment or special study. You make a change, and then compare the results of that change with some control group. Imagine doing an A/B test. For the sake of convenience, let’s call this approach ‘Experimental Studies’.
- Other data occur as a by-product of some operation. As a business process runs, it throws off some data that you observe. Imagine monitoring web traffic, inventory turns, or working capital at your company. We’ll call this approach ‘Observational Studies’.
The two environments lead to two different attitudes to data analysis. As I’ve put the ideas from the Becoming Data Driven series to practice, I’ve become increasingly aware of the differences in worldviews between these two approaches.
I’ll summarise the two approaches, talk about why the differences in worldviews matter and then close with some notes of my own.
Experimental Studies
A product manager comes up to you and says “we made this change in the onboarding flow, and it led to a 14% increase in activation rate.” What is your first reaction?
If you’ve been trained in modern product growth methods, your response would likely be something like “how do you know that change is statistically significant?”
You are asking for a comparison study. That is: ideally the product manager kept a portion of users in reserve, and then exposed a select group of users to the new change in onboarding flow. This way, the product manager is able to compare user behaviour between the old flow and the new flow, and calculate if changes in user behaviour are ‘statistically significant’.
Statistician Donald Wheeler writes:
When you do an experiment you will usually be comparing two or more conditions to determine which condition is, in some sense, better. A set of observations will be collected under each of the conditions, and these observations will form the basis of the comparisons. Since each condition will usually require special set-ups and dedicated runs, you will always have a limited amount of data to use in making the comparisons. This will affect the way in which you analyse these data. In particularly, having just paid good money to create what you hope will amount to true signals of a difference, you will naturally want to detect any real differences that are present. Thus you will want a reasonably sensitive analysis in spite of the fact that you have a limited amount of data to use. Given these constraints, it is customary to accept a nontrivial risk of a false alarm. (Traditionally, this risk is known as the alpha-level and is commonly set at five percent). With a one-time analysis, a five percent risk is generally small enough to allow us to interpret these differences that we detect as if they are real differences.
(... emphasis Wheeler) Thus, with an Experimental Study, we use a finite amount of data to perform a one-time analysis while looking for differences that we have tried to create by means of the experiment. To have a sensitive analysis we usually accept a non-trivial risk of a false alarm.
Observational Studies
A finance manager comes to you and says “it appears that our working capital is down 21% in the previous month compared to the month before.” What is your reaction?
If you are familiar with methods from Statistical Process Control (SPC) — methods we’ve discussed over the course of this series — you would ask: “wait, how do you know this is not just routine variation?”
Here you are asking for slightly something slightly different: you are asking for knowledge of variation. Every business process displays some routine variation. Open a business dashboard — any dashboard — and you’ll see a line that wiggles up and down. In this situation what you’ll want to know is if the change you’re seeing is exceptional — that is, is out of the ordinary and worthy of investigation. Often the response is “let’s wait and see if this is something to worry about.”
This is the heart of analysis in an observational context. Notice how different it is from an experimental context! Wheeler writes, again from the same book:
When the data are a by-product of operations you will usually be trying to operate the process in some steady state. Here you will usually want to know whether or not an unplanned change has occurred. This is a completely different question from the one considered with experimental data. Now only one condition is present, rather than two or more. Here we are not looking for a difference that we think is there, but asking if an unknown change has occurred. Before we sound an alarm we will want to be reasonably certain that a change has indeed occurred, making our approach to analysis conservative. Moreover, since a change can occur at any time, this question needs to be continually asked of the process. As each value is obtained you can use it to see if a change has occurred. This makes every point added to a chart into a separate act of analysis. Thus, an Observational Study, of necessity, requires a conservative, sequential analysis technique (emphasis added).
With a sequential analysis we risk having a false alarm with each new data point, and the only way to keep the overall risk of a false alarm from getting excessively large is to perform each individual act of analysis with a very small risk. While this may make each individual analysis fairly insensitive, with an Observational Study we have the luxury of waiting for the data to show any change that does occur. Hence, we can afford to perform each individual analysis with a trivial risk of a false alarm (usually a risk of less than one percent is preferred). In this environment, when we get a signal we can be reasonably sure that a change has indeed occurred in the process.
(emphasis Wheeler) Thus, with an Observational Study, we perform a sequential analysis using a continuing stream of data while looking for signals of any unknown or unplanned change which may occur. To minimise false alarms we require a trivial risk of a false alarm for each individual act of analysis.
Why Does This Matter?
Why are these differences important? The short answer is that each type of analysis forces a different set of tradeoffs.
Before we talk about those tradeoffs, though, let’s take a step back to talk about why analysis matters.
When we use data in a business context — be it with Experimental Studies or Observational Studies — what we’re trying to get at is ‘knowledge’. Knowledge is defined as “theories or models that allow you to predict the outcomes of your actions”. This is one of the core ideas of the Data Driven Series, and the idea comes directly from W Edwards Deming.
Long-time readers of the series would know what I’m talking about. For new readers, however, here is what ‘knowledge’ looks like:
- “We know that buying Facebook ads has less of an effect on sales than newsletter campaigns. This change occurred in February this year.” (Consider: how do you get to this level of certainty? What does this imply that we do next?)
- “We saw a statistically significant lift in user activations after changing our onboarding flow. This is great, because we’ve noticed that new cohorts of users aren’t activating as well — starting late last year.” (How did you find out? Does the fact that this worked give you a better intuition for new features?)
- “I predict that going to X conference isn’t going to result in much sales, because our ideal customer has changed, and is no longer the type of person who attends such conferences.” (How did you find this out, and what channels might you target instead?)
Compare that with the following examples:
- “Hmm, sales seems to have slumped. Should we increase spend on Facebook, or try TikTok, or perhaps start sponsoring creators on YouTube?” (Throw everything at the wall and hope it sticks).
- “As part of last week’s release, we deployed a change in our onboarding flow that made the flow smoother and nicer. I would like to congratulate John, who led the effort.” (What exactly did you learn here, apart from ‘we can ship nice things’? Good product teams tend to prioritise the acquisition of knowledge. Bad product teams prioritise throwing features over the wall.)
- “Perhaps we should sponsor a golf tournament? Lots of CEOs watch the Masters. Doesn’t hurt to try, right?” (Throw everything at the wall and hope it …)
Of course, quantitative data isn’t the only way to get at such knowledge — you can also get at knowledge through qualitative means. In my experience, I’ve found it easier to learn to talk to customers than to run a metrics review. But your mileage may vary.
The overarching point is that you have multiple methods to gain knowledge. These methods map to the examples I’ve given you above:
- You can use Observational Studies to understand how your business works (at some point in February, you must have seen a change in variation in traffic from Facebook ads, even as your ad budget remained the same).
- You can use Experimental Studies to figure out user behaviour (you roll out a change to your onboarding flow but keep a holdback population to see if it results in a detectable change between the two groups).
- You gather qualitative data to understand your ideal customer (in this case you’ve done enough sales calls to know who your current ideal customer is; you know there is no way in hell said persona will attend conference X or watch a golf tournament).
I’ve found it super useful to have the entire domain of analysis reduced down to one question: “how is this going to give me knowledge?” Knowledge has predictive power. True knowledge should lead to effective action. So it’s not enough to talk to a customer and go “ok she likes us” or look at a chart and go “oh, so this week we have 5325 visitors to our pricing comparison page” — you have to know why such and such customer likes you (so that you may find more customers like her) or how to make those visitor numbers go up (or if you even want them to go up: do they correlate with increased sales? Do you have — heh — knowledge of this fact?)
Tradeoffs Between Experimental Studies and Observational Studies
Okay, enough of a recap. Let’s talk about those tradeoffs.
Tradeoff One: Sensitivity
The first tradeoff is that data analysis techniques from the domain of Experimental Studies are far more sensitive than techniques from the domain of Observational Studies. The tradeoff for this sensitivity is that experiments are expensive to run, and in some cases, impossible to do.
Wheeler writes:
Traditional classes in Statistics focus on Experimental Studies and the analysis techniques that are appropriate for this data. SPC is concerned with how to analyse the data from Observational Studies. When students, or even their instructors, fail to make a distinction between these two types of data, confusion is inevitable.
(...) Confidence intervals, tests of hypotheses, and regression techniques are all designed to get the last ounce of information out of a fixed and finite amount of experimental data. Probability models and critical values are intended to sharpen up the analysis so no reasonable signal of a difference is overlooked. These are all tools for the analysis of data from Experimental Studies.
In contrast to all of the above, process behaviour charts separate the potential signals from the probable noise by using generic and fixed three-sigma limits. Moreover, they allow us to perform this separation using data obtained under operational conditions, without the need to perform special experiments or studies. They are tools created for use in Observational Studies.
Here’s a concrete example. We’ve been attempting to get visitors to visit Commoncog’s topic cluster pages. As a result, I have added ‘topic bars’ at the top and bottom of Commoncog’s posts. Our hypothesis is that this should increase the value of Commoncog’s archives.
Has this led to a behaviour change? Here’s a process behaviour chart of 12 weeks worth of ‘In Depth Readers’ (readers who visited more than one page), after introducing topic bars:
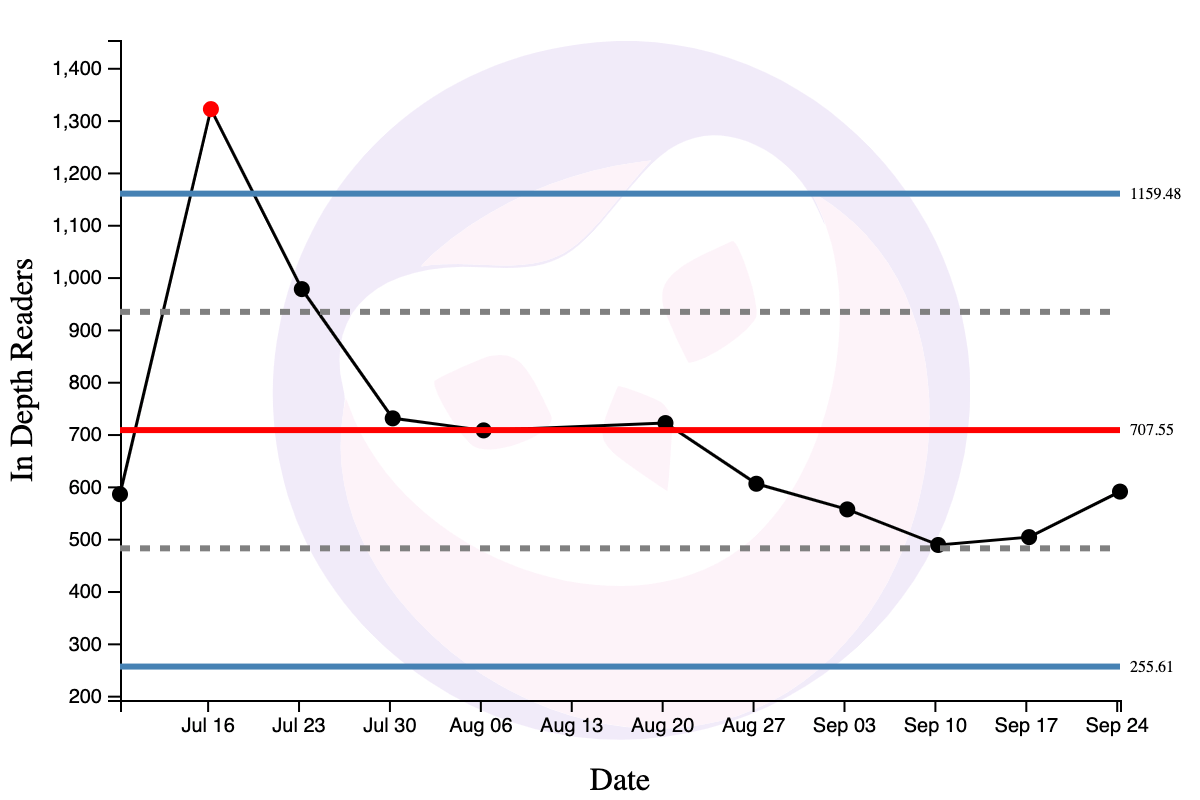
Apart from the spike in the week of July 16 — which was when Commoncog went viral via Hacker News — there doesn’t seem to be a sustained change from topic bars that’s worth discussing. But: if the behaviour change is subtle, this may not show up in my metrics! If I had run an A/B test, on the other hand, I would likely be able to pick up on subtler changes, assuming my experimental groups are sufficiently large.
I should add that this is somewhat of a contrived example, at least for my context. Tiny, barely detectible changes aren’t worth pursuing when you have such small numbers, like I have with Commoncog. The effort needed to run a full test is better spent on other things. But the broader point still stands: sometimes tiny changes are worth doing (e.g. you are Google, or Instagram, and a 2% change is literally worth millions of dollars). That’s when analytical methods from Experimental Studies really shine.
But even for large companies, experimental studies aren’t always possible. For questions such as “we’ve seen a dip in our working capital, is this something we should worry about?” — you cannot split the company into two parallel universes to test how different business activities affect cash. You are forced to use techniques from the domain of Observational Studies to figure out what’s happened.
Tradeoff Two: Time
The second tradeoff is time.
Here’s a live example. As I write this, one experiment I’m running is including the links to the most interesting (and active) member’s forum topics in the weekly Commoncog newsletter. Our intended goal is to drive forum activity up, ahead of a relaunch of the Commoncog Case Library. The inclusion of links in the Commoncog newsletter started on October 18:
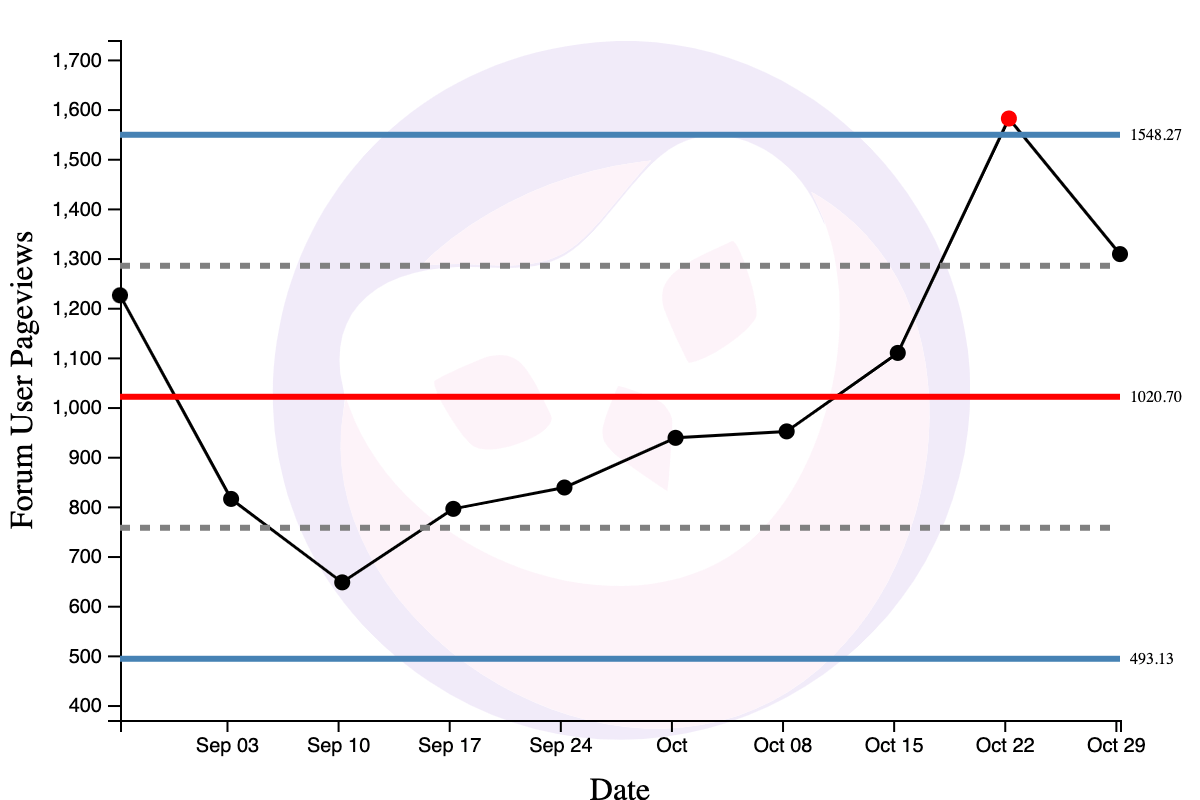
Which clearly led to one point of special variation (the red point above).
But I will have to wait around six weeks to see what the new process behaviour of forum user pageviews looks like. As of writing, I only have two data points after the change, which results in extremely wide limit lines:
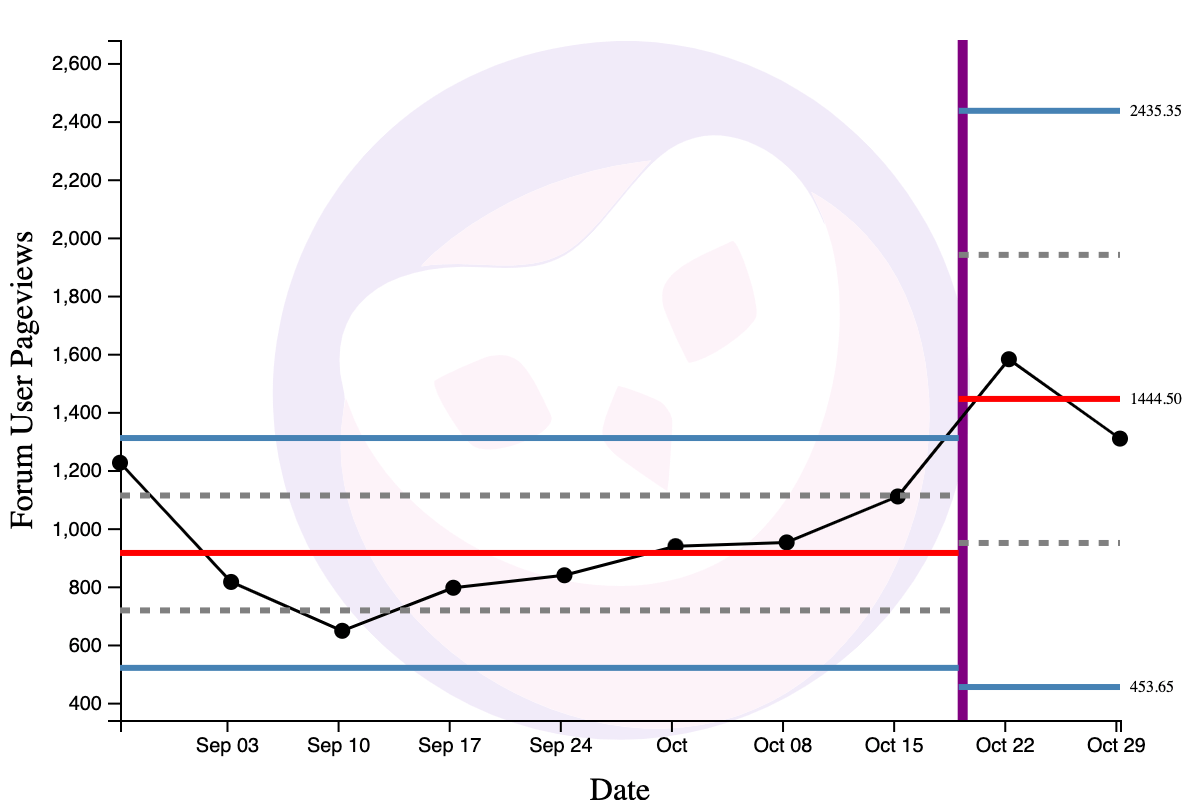
Process behaviour charts require at least six data points for usable limit lines, and ideally 10-to-15 data points for the limit lines to settle. All of this takes time. The reason I’d like to wait is that I want the new process behaviour to become clear before starting a new experiment for forum user pageviews. In the meantime, my team is experimenting with alternative input metrics to increase forum engagement.
Wheeler portrays this ability to wait for new data points as a ‘luxury’ — and I guess it is, given that I don’t have to do any experimental setup to get such results. But sometimes, goddamn, I just want to know what my actions have accomplished … today.
Wrapping Up
Wheeler is fond of saying that ‘the purpose of analysis is insight, which means the best analysis is the simplest analysis which provides the needed insight.’ This is good advice. You really want to reach for the simplest tool you have. (Sometimes, to be fair, that tool is a series of customer interviews).
The goal of techniques from both types of data analysis is knowledge. Given the time costs of Commoncog’s current Observational Study approach, I’ve become increasingly appreciative of the sensitivity, power, and usefulness of experimental studies, despite the increased sophistication (and work!) required to use them in practice.
But I think it’s useful to recognise that both types of tools have their place. Nearly everyone in business needs assistance in interpreting operational metrics (“omg working capital is down bad ... is it?”); that doesn’t preclude you from running experiments to uncover causal mechanisms — assuming you have the numbers to do it. In the end, though, data analysis is powerful precisely because it helps you learn things about your business that you otherwise cannot see.
This is Part 11 of the Becoming Data Driven in Business series. Read the next part here: Becoming Data Driven, From First Principles.
Originally published , last updated .
This article is part of the Operations topic cluster, which belongs to the Business Expertise Triad. Read more from this topic here→
The thought of business school make you go ‘eww’?
You’re in good company.
9,000+ investors and operators read Commoncog to sharpen their business acumen ... WITHOUT going back to school.
Sign up for our newsletter and get a weekly dose of good business thinking (no BS guaranteed):